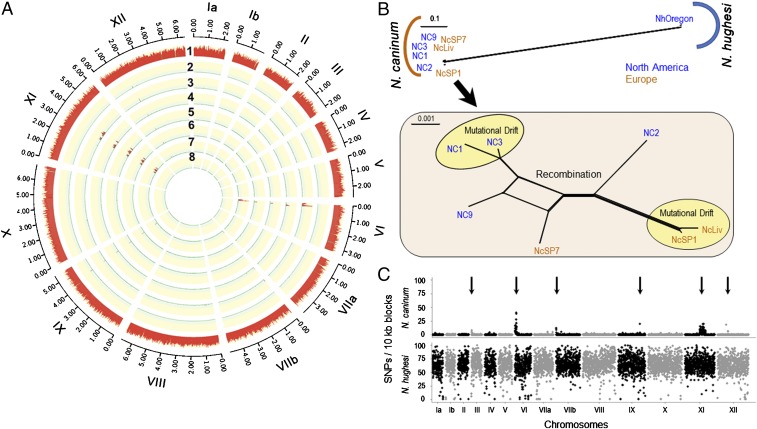
Fig. 2.
Phylogenomic analysis of Neospora based on WGS. (A) N. caninum: Circos plot depicting SNP density using NcLiv as the reference strain (SI Appendix, Fig. S6 and Dataset S1, SNPs found in Neospora strains). Chromosomes are numbered by Roman numerals and size intervals are plotted using Arabic numerals. The red track with the yellow background indicates the number of SNPs per 10-kb sliding window. Strain names: 1) NhOregon, 2) NcSP1, 3) NC2, 4) NC3, 5) NcSP7, 6) NC9, 7) NC1, and 8) NcLiv. (B) Neighbor-net analysis of 8 Neospora strains using genome-wide SNPs (375,560) (SI Appendix, Table S3) indicates 2 distinct populations of Neospora (N. caninum and N. hughesi) with significantly high genetic distance. Zooming-in on the N. caninum population (Inset) shows very low genetic diversity (total = 5,766 SNPs). The yellow circles denote strains that are in genome-wide LD and are separated by mutational drift, whereas the other strains possess a reticulated structure, indicating that gene flow has occurred between these remaining isolates (red). Strains are colored based on their continent of origin. (Scale = no. of SNPs per site.) (C) SNP density plots using the average number of SNPs present within 10-kb sliding windows when compared with the reference strain NcLiv. The y axis shows the number of SNPs per 10-kb sliding window and identified 6 distinct sequence blocks that possessed elevated SNPs (arrows). The x axis indicates the relative size of the chromosome. Chromosomes are separated by black and gray colors.

