Fig. 4.
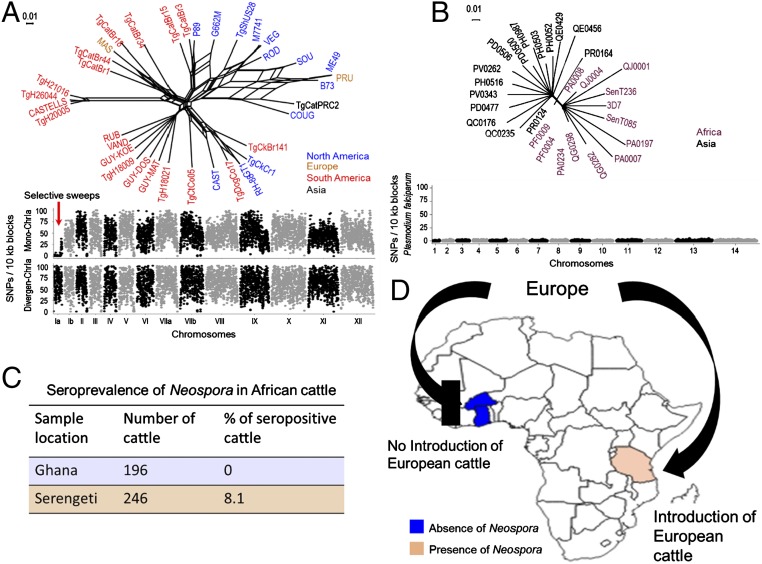
Recent expansion of N. caninum worldwide through European cattle movement. (A) Population genetic structure of T. gondii based on neighbor-net analysis using genome wide SNPs (total = 1,065,685) from 36 strains (SI Appendix, Table S4). Strains are colored based on their continent of origin. (Scale = no. of SNPs per site.) The SNP density plot shows the monomorphic distribution of SNPs on chromosome Ia for most of the T. gondii strains (red arrow). Each dot indicates the average number of SNPs present within 10-kb sliding windows compared with the reference strain Me49. y axis = no. of SNPs per 10-kb window, x axis = relative size of chromosome. (B) Neighbor-net analysis indicates that recent drug-resistance selective sweeps that have shaped the population genetic structure of P. falciparum. Neighbor-net analysis was conducted based on 8,810 SNPs among 28 strains (SI Appendix, Table S5). Strains are colored based on their continent of origin. (Scale = no. of SNPs per site.) SNP density plots indicate the monomorphic distribution of SNPs in the P. falciparum genome. Each dot indicates the average number of SNPs present within 10-kb sliding windows comparing with the reference strain 3D7. y axis = no. of SNPs per 10-kb window; x axis = relative size of chromosome. (C) Blood samples collected from West and East African cattle (SI Appendix, Table S6) were subjected to serological testing for the presence of Neospora antibodies. Orange and blue regions indicate the presence and absence of Neospora antibodies, respectively. (D) Schematic representation and map of Africa with the location of the cohort enrollment sites and direction of European cattle movement (C) (SI Appendix, Table S6).

