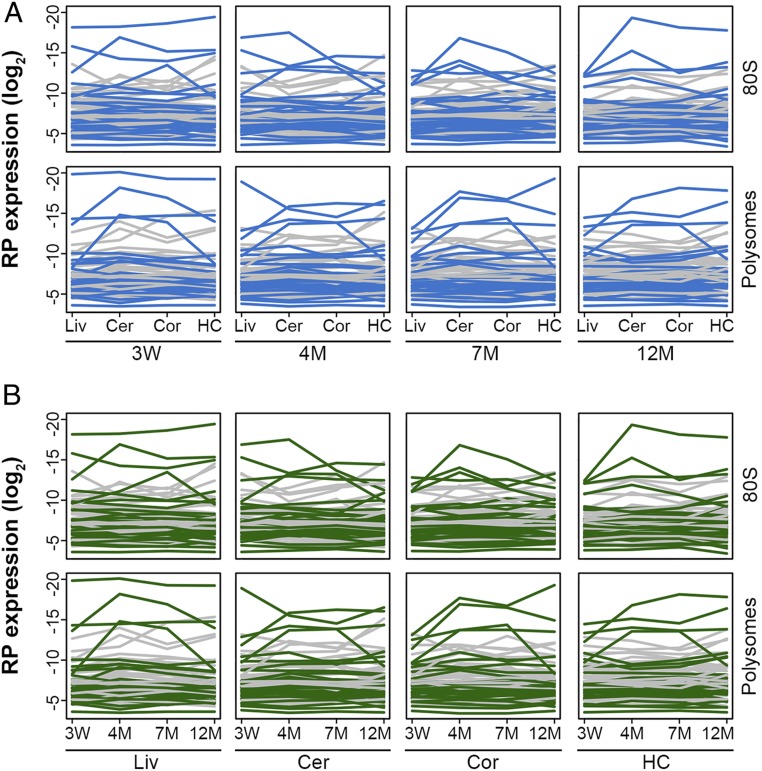
Fig. 2.
Changes in expression of single RPs across tissue and age are not significant. (A and B) Comparison of the RP levels in tissues of the same age (A) or across ages within the same tissues (B). Gray, proteins of 40S; green or blue, proteins of 60S. Despite fluctuating expression, none of the proteins show significant changes in their amounts (FDR < 0.1) in the respective sample or population. Cer, cerebellum; HC, hippocampus; Cor, cortex; Liv, liver; W, week; M, month.

