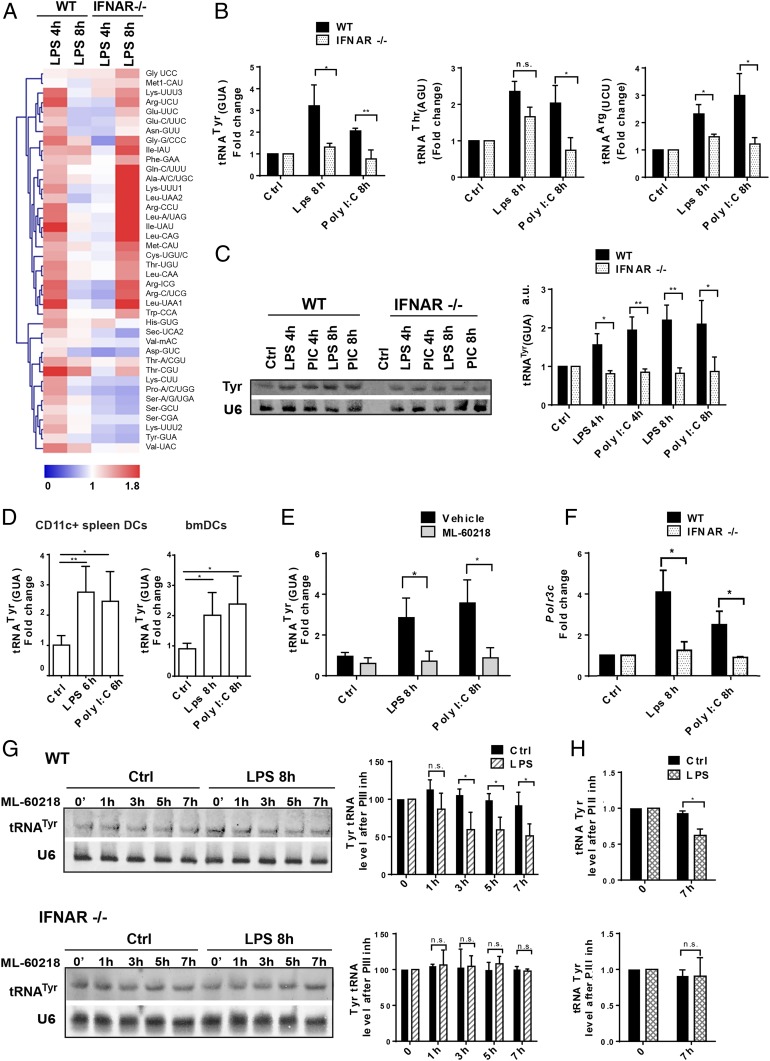
Fig. 1.
Alterations of tRNA transcription following DC activation by MAMPs. (A) Heatmap of tRNA expression levels measured by tRNA-tailored microarrays of WT and IFNAR−/− DCs stimulated with LPS for 4 and 8 h. Data (n = 2) are relative to the expression levels at time point zero. tRNAs are presented by their cognate amino acid and anticodon. Meti-CAU and Met-CAU are initiator and elongator tRNAMet (CAU), respectively. (B) tRNATyr (GUA), tRNAThr (AGU), and tRNAArg (UCU) levels measured by RT-qPCR in WT and IFNAR−/− DCs stimulated with LPS or Poly I:C for 4 and 8 h. (C) tRNATyr (GUA) levels measured by Northern blot in WT and IFNAR−/− DCs; densitometry quantifications are shown (Right). (D) tRNATyr (GUA) levels measured by RT-qPCR in bmDCs and CD11c+ spleen DCs. (E) tRNATyr (GUA) levels measured in LPS or Poly I:C-activated DCs, treated with the Pol III inhibitor ML-60218 by RT-qPCR. (F) Polr3c mRNA levels measured by RT-qPCR in WT and IFNAR−/− DCs. (G) Northern blot analysis of tRNATyr (GUA) decay in LPS-activated WT and IFNAR−/− DCs treated with ML-60218 for indicated time; densitometry quantification is shown (Right). (H) Decay of tRNATyr (GUA) analyzed by RT-qPCR in WT and IFNAR−/− DCs after 7 h of LPS and ML-60218 treatment. Data in B–H are mean ± SD (n = 3). n.s., nonsignificant results; *P < 0.05, **P < 0.01 by unpaired Student’s t test.

