Fig. 3.
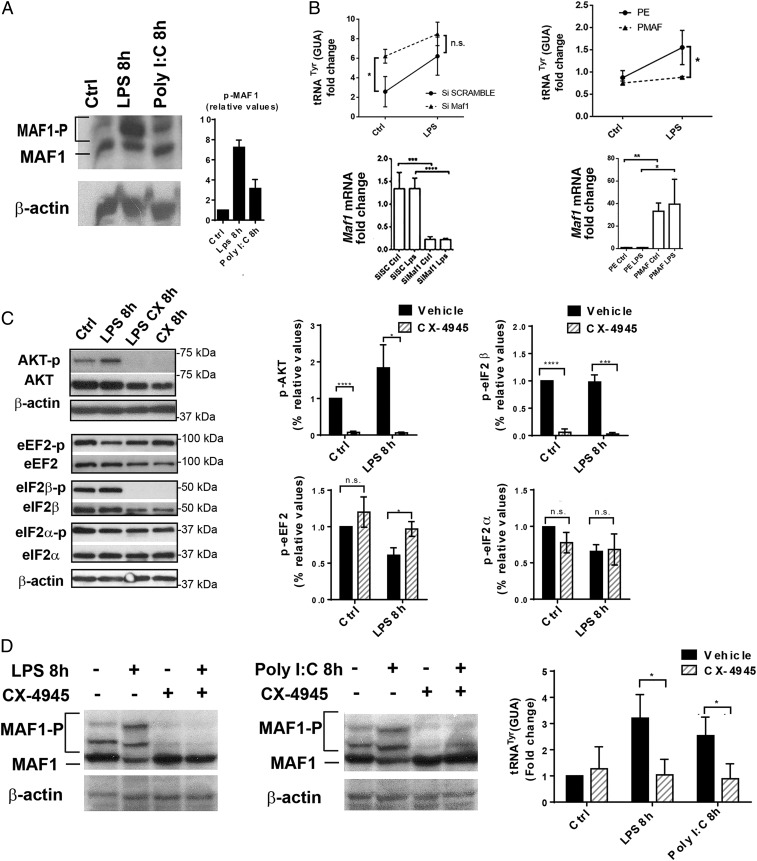
MAF1-dependent Pol III activity is controlled by CK2. (A) MAF1 phosphorylation in DCs stimulated with LPS and Poly I:C was analyzed by Phos-Tag immunoblotting; β-actin serves as control. Quantification is shown on the Right. (B) Maf1 silencing in DCs (Maf1 KD) and LPS activation for 4 h. Scrambled siRNA (SC) serves as control. Maf1 overexpression in DCs (PMAF) compared to control transfected with empty vector (PE). tRNATyr (GUA) and Maf1 mRNA levels were analyzed by RT-qPCR. Data are mean ± SD (n = 3). (C) LPS-activated DCs treated or not with CK2 inhibitor CX-4945 were subjected to immunoblotting. Levels of p-AKT, total AKT, p-eEF2, total eEF2, p-eIF2β, total eIF2β, p-eIF2α, and total eIF2α were analyzed. All data (mean ± SD) are representative of n = 3 independent experiments; quantification is shown on the Right. (D) Phos-Tag immunoblotting for P-MAF1 in DCs stimulated with LPS, Poly I:C, and treated with CX-4945 for 8 h; β-actin is used as control. Levels of tRNATyr (GUA) were measured by RT-qPCR. Data are mean ± SD (n = 3). In B–D n.s., nonsignificant results; *P < 0.05, **P < 0.01, ***P < 0.001, and ****P < 0.0001 were obtained by unpaired Student’s t test.

