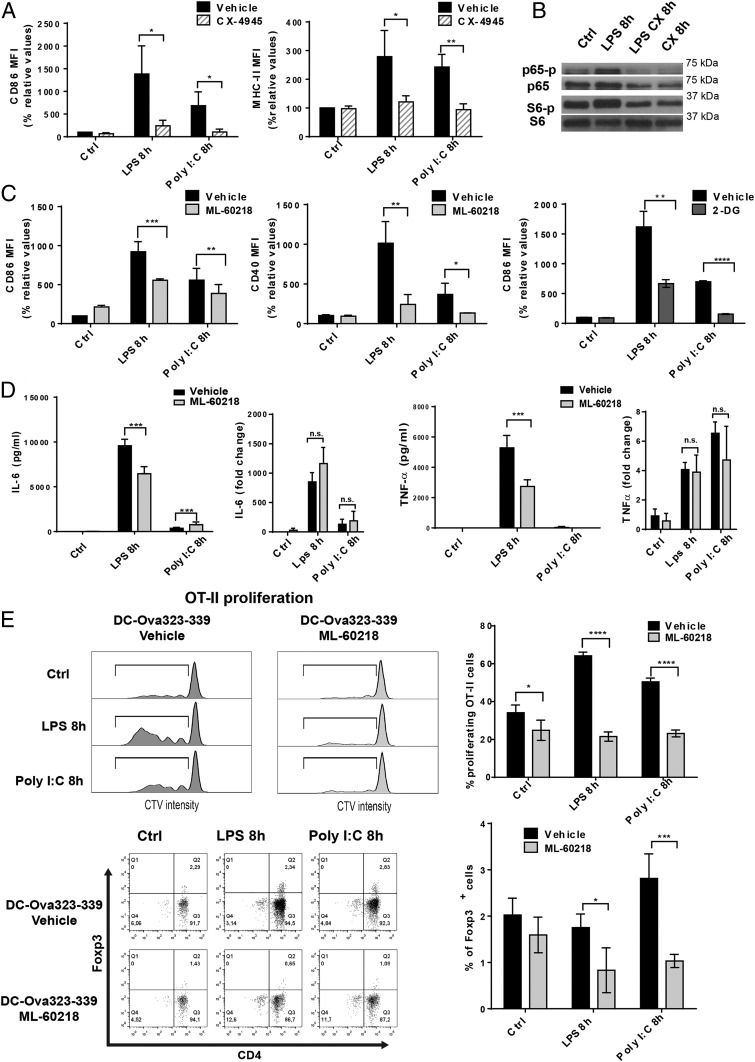
Fig. 5.
Pol III activity is required for DC activation and T cell priming. (A) DCs stimulated with LPS, Poly I:C, and treated with CX-4945. Surface up-regulation of costimulatory molecules CD86 and MHCII was measured by flow cytometry and is presented as mean fluorescence intensity (MFI). (B) DCs activated with LPS, treated with CK2 inhibitor CX-4945 for 8 h, and processed for immunoblotting. Analysis of p-p65, p65, p-S6, and S6 levels. (C) DCs stimulated with LPS, Poly I:C, and treated with the Pol III inhibitor ML-60218 for 8 h. Surface up-regulation of costimulatory molecules CD86 and CD40 was measured by flow cytometry and is presented as MFI. DCs were also stimulated with LPS, Poly I:C, and treated with 2-DG for 8 h, and surface CD86 levels were analyzed by flow cytometry. Data are mean ± SD (n = 3). *P < 0.05, **P < 0.01, ***P < 0.001 by unpaired Student’s t test. (D) The concentrations of secreted IL-6 and TNF-α were measured by ELISA. IL-6 and TNF-α mRNA levels were quantified by RT-qPCR. Data are mean ± SD (n = 3). ***P < 0.001 by unpaired Student’s t test. (E) OT-II proliferation assay. DCs stimulated with LPS, Poly I:C, and treated with ML-60218 for 8 h and loaded with the OVA 323 to 339 peptides. DCs were incubated with CellTrace Violet (CVT)-labeled OT-II/Rag-2−/− T cells for 4 d and analyzed by flow cytometry for CTV dilution and Foxp3 expression. Quantification of the percentage of proliferating OT-II cells and Foxp3+ cells are shown on the Right. Data are mean ± SD (n = 3). n.s., nonsignificant results; *P < 0.05, **P < 0.01, ***P < 0.001, ****P < 0.0001 by unpaired Student’s t test.

