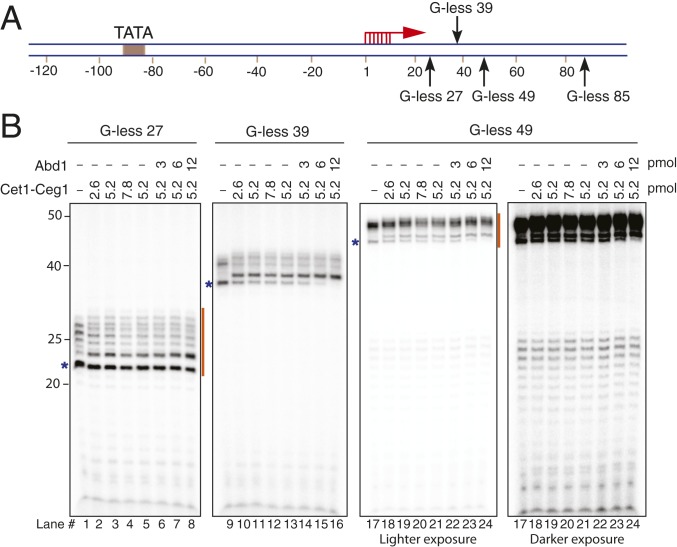
Fig. 1.
Transcription initiation assay with a series of G-less SNR20 promoter variants. (A) Schematic diagram of the SNR20 promoter variants. The TSSs (red arrows) and G-stops (black arrows) are indicated. (B) PIC was formed on the indicated SNR20 promoter DNA variants with TFIIA, TFIIB, TBP, TFIIE, TFIIF, TFIIH, Sub1, and pol II. Transcription was initiated by addition of ATP, CTP, 3′-O-methyl GTP, UTP, and [α-32P]UTP and then incubated for 20 min at 30 °C. Varying concentrations of Cet1-Ceg1 and Abd1 were added at the time of addition of NTPs. Orange lines indicate the sets of transcripts that were used to calculate transcription efficiency in Table 1. The bands indicated by blue asterisks are used for quantification of the shift in RNA mobility in SI Appendix, Fig. S3A.

