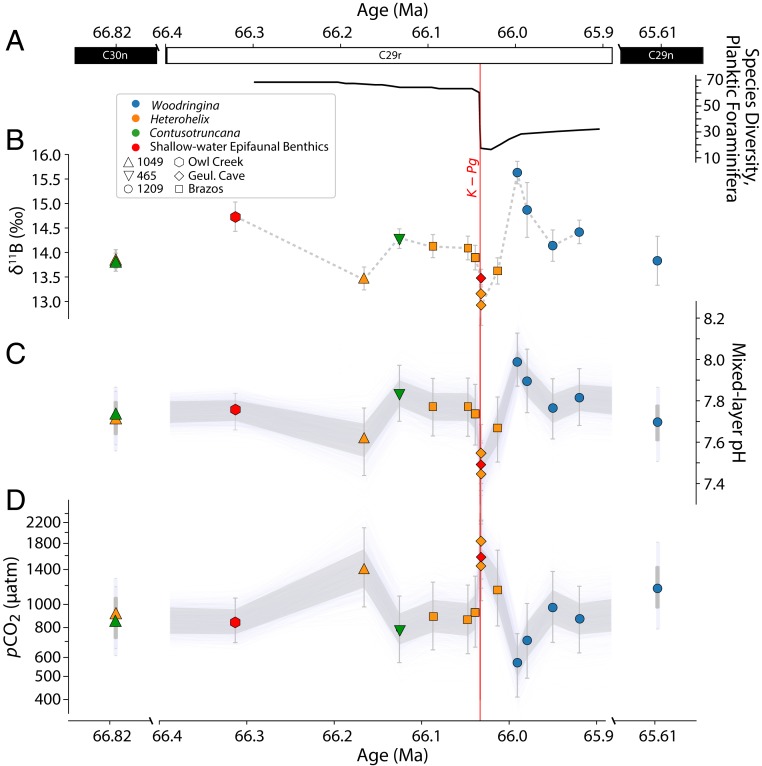
Fig. 1.
Records of surface ocean foraminiferal δ11B (B), calculated pH (C), and pCO2 (D) across the K-Pg boundary, with high-resolution foraminiferal diversity counts from ref. 39 at the K-Pg Global Boundary Stratotype Section and Point (El Kef) plotted for context (A). pH is calculated assuming our best estimate of K-Pg δ11Bsw, 39.45 ± 0.4‰. pCO2 is calculated from pH along with total alkalinity estimates at each site from a GENIE late Maastrichtian simulation, adjusted for dynamic changes in alkalinity across the K-Pg using LOSCAR simulations from ref. 22 that match observed patterns of carbonate burial. Gray shaded areas are 1-sigma uncertainties, with thin lines representing 1,000 Monte Carlo simulations from the 10,000 that were run. For clarity, we only plot those samples that represent the surface mixed layer, which should be approximately in equilibrium with the atmosphere. Additional data from deep-sea benthic and thermocline-dwelling planktic foraminifera that do not reflect atmospheric pCO2 can be seen in Fig. 2 and in Dataset S1. For details of the age models used, the estimation of δ11Bsw, carbonate system calculations, and uncertainty propagation see SI Appendix.

