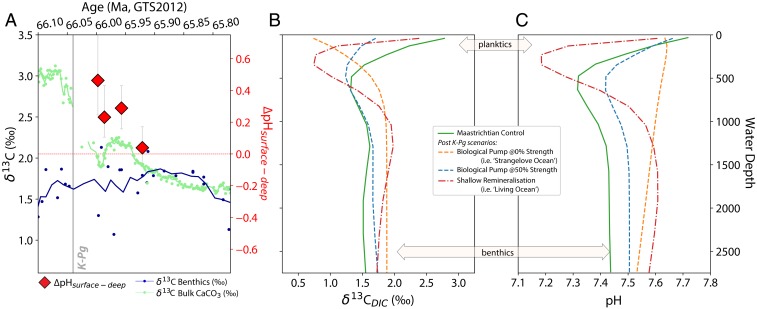
Fig. 2.
Paired benthic–planktic foraminiferal δ11B measurements from 4 time slices following the K-Pg boundary at ODP Site 1209 (Shatsky Rise) are used to calculate the difference in surface and deep ocean pH (∆pH; red diamonds, A). These data show a trend from “normal” patterns of higher δ11B/pH in the surface ocean relative to the deep until 65.92 Ma, where this gradient disappears (see also SI Appendix, Fig. S12). Shown for context is the convergence in δ13C from surface waters (bulk CaCO3, in green) and deep ocean waters (benthic foraminifera, navy) (A). Water column δ13C and pH profiles in the cGENIE model the location of Shatsky Rise (see also Fig. 3) are shown in B and C, respectively. A weakened or reversed δ13C gradient can arise in a number of ways (B), but only a shallow remineralization (or “Living Ocean,” red dot-dashed line) model can produce a flat gradient in pH between the surface 80 m and 2,500-m water depth (C). Carbonate data from ODP 1209 include new data and benthic data from ref. 34. See SI Appendix for more details.

