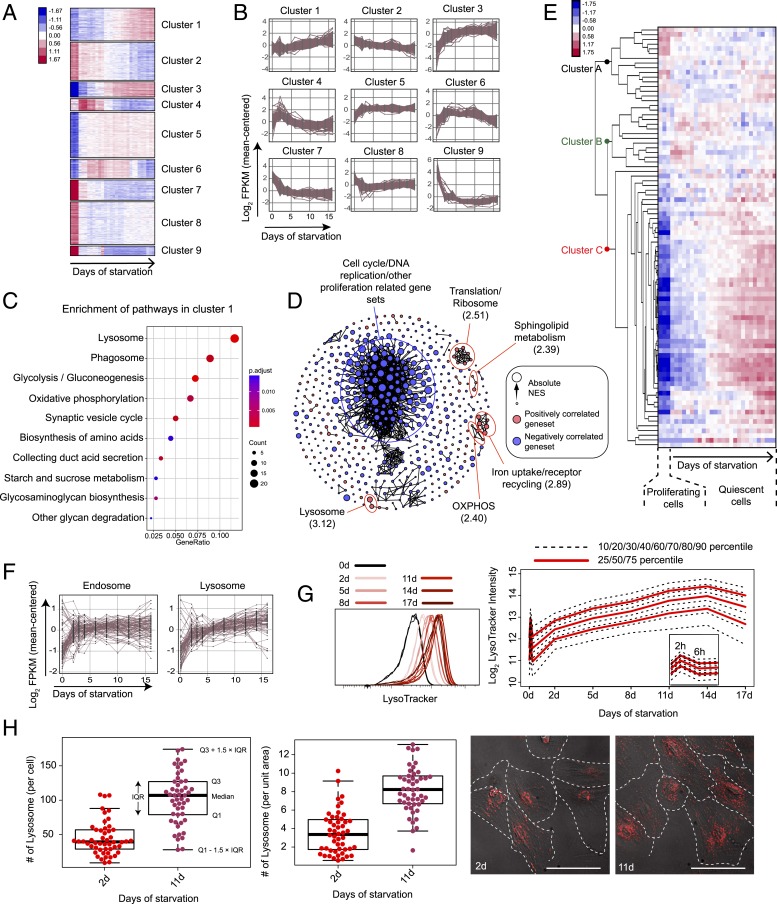
Fig. 2.
Lysosomal gene expression and lysosomal mass increase along quiescence deepening. (A) K-means clustering of 2,736 differentially expressed genes in RNA-seq analysis. Sample columns (0-, 2-, 3-, 4-, 6-, 8-, 10-, 12-, 14-, and 16-d serum starvation) are ordered chronologically with 3 replicates at each time point. Up- and down-regulation of genes are shown in red and blue, respectively; color gradient bar indicates the degree of change in gene expression (normalized and log-transformed; see Materials and Methods for details). (B) Gene-expression dynamics within each K-means cluster in A. Expression of each gene in a given cluster is shown in a time-course curve. (C) Pathways enriched (P < 0.05) in cluster 1. GeneRatio (x axis) and dot size indicate the fraction and number of genes involved in the indicated pathway in cluster 1, respectively. Color gradient bar indicates statistical significance of pathway enrichment in KEGG overrepresentation test based on P values adjusted by Benjamini-Hochberg correction. (D) Gene sets significantly correlated to quiescence depth (false-discovery rate < 0.1) in GSEA analysis. Gene sets are connected by edges based on their similarity (Jaccard index ≥ 0.5) when applicable. Gene sets positively and negatively correlated to quiescence deepening are shown in red and blue nodes, respectively. Node size represents the absolute NES in the GSEA result. Biological functions that are the most negatively and positively (top 5 in statistical significance) correlated with quiescence deepening are demarcated by blue and red circles, respectively; the maximum NES value of all enclosed nodes in a circle is shown in parenthesis. (E) Heat map of time-course expression of lysosomal genes in RNA-seq analysis (0- to 16-d serum starvation). Lysosomal genes (rows) are defined by the Mouse Genome Database (MGD) (83) and ordered by hierarchical clustering (with gene names shown in SI Appendix, Table S1). RNA-seq samples (columns) are ordered chronologically (as in A). Color gradient bar indicates the degree of change in gene expression as in A. (F) Time-course expression of differentially expressed endosomal and lysosomal genes in RNA-seq analysis (0- to 16-d serum starvation). Endosomal and lysosomal genes are defined by the MGD (83). (G) LysoTracker intensity of serum-starved REF cells. LysoTracker intensity distribution of each cell population (0- to 17-d serum starvation, triplicates of ∼10,000 cells each) is shown (Left); the log2-transformed agglomeration of the triplicates at each time point is plotted with the indicated percentiles (Right). (H) Number of lysosomes (LysoTracker foci) per cell and per unit area of cell in 2- and 11-d serum-starved cells (n = 50 each). Box plot: Q1 and Q3 refer to the first and third quantiles, respectively; IQR, interquartile range = Q3 − Q1; the same below unless otherwise noted. (Inset) Representative lysoTracker foci microscopy. Each red dot represents a LysoTracker-stained lysosome in the cell. (Scale bar, 50 µm.) Cell boundaries were manually determined using both POL and Cy5 filters.

