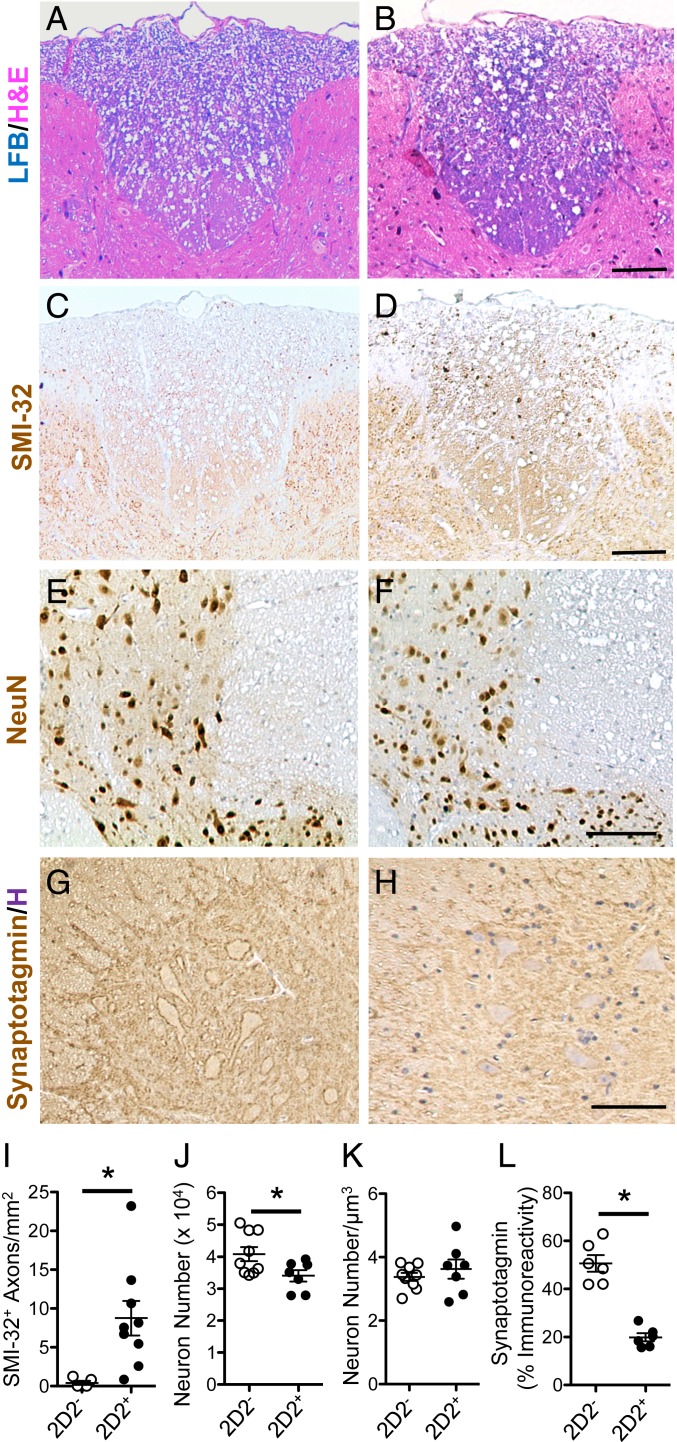
Fig. 6.
White matter and gray matter pathology seen in long-term hind-limb clasping PPARαmut/WT 2D2+ mice. (A–H) Representative images of the posterior thoracic spinal cord white matter in aged PPARαmut/WT 2D2− (A, C, E, and G) or PPARαmut/WT 2D2+ (B, D, F, and H) mice stained for LFB/H&E (A and B), SMI-32 (C and D), NeuN (E and F), or synaptotagmin (G and H). (Scale bars: A–F, 100 µm; G and H, 50 µm.) (I–L) Histology scoring for PPARαmut/WT 2D2+ and PPARαmut/WT 2D2− mice. (I) SMI-32+ axons per square millimeter (n = 9 mice per group). (J and K) Number of NeuN+ nuclei in the gray matter determined using the optical fractionator method (J) and normalized per cubic micrometer tissue sampled (K; n = 7 2D2+, n = 9 2D2− mice per group). (L) Immunoreactivity for synaptotagmin in the gray matter of the spinal cord (n = 6 per group). In all cases, values are means ± SEM of values obtained in individual mice. Sample sizes differed according to stain since not all antibodies worked in all sections due to sample overfixation or decalcification. *Significantly different by Mann–Whitney U test (2-tailed) (P ≤ 0.05).

