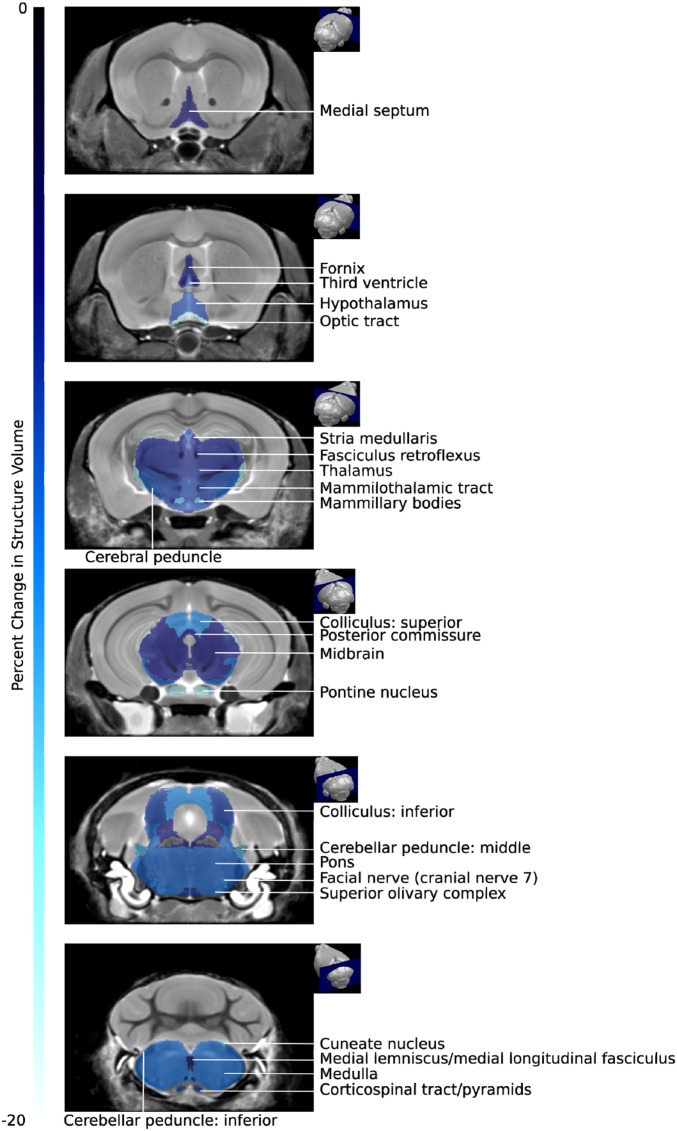
Fig. 7.
Atrophy was prominent in certain brain structures that were directly impacted by inflammation or were in close proximity to the spinal cord. Coronal MRI slices showing the differences in absolute structure volume between PPARαmut/WT 2D2+ and PPARαmut/WT 2D2− mice (FDR 10%). Slices arranged from the anterior (Top) to posterior (Bottom). The percentage change in brain structure volume is indicated by the color scale bar shown on the left.

