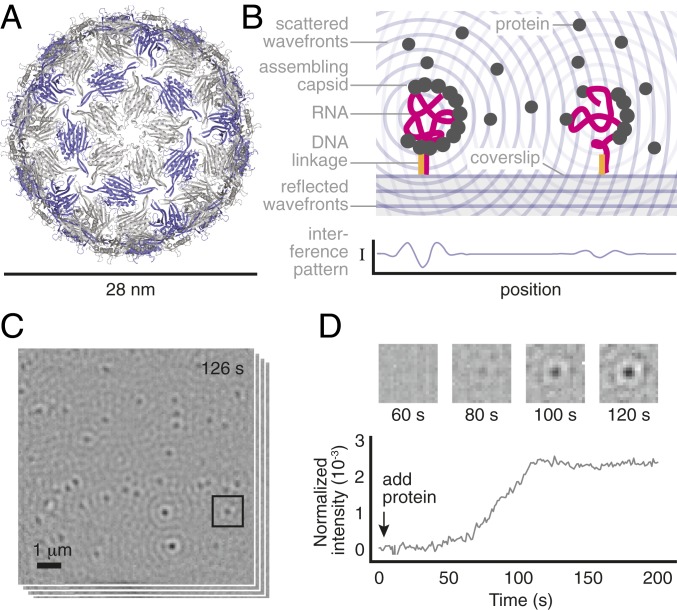
Fig. 1.
Overview of the measurement. (A) A structural model of the MS2 capsid (PDB ID: 2ms2) shows its small size and structure. The 2 coat-protein dimer configurations are shown in gray and purple. (B) We inject a solution of unassembled dimers over a coverslip on which MS2 RNA strands are tethered by DNA linkages. As dimers bind to the RNA, the resulting particles scatter light. The particles appear as dark, diffraction-limited spots because of destructive interference between the scattered light and a reference beam. (C) We monitor many such spots in parallel. Shown is a typical image of the field of view, taken 126 s after adding 2-M dimers and representing an average of 1,000 frames taken at 1,000 frames per second. (D) The intensity of each spot is proportional to the number of bound proteins within each particle and changes in the intensity as a function of time reveal the assembly kinetics of each particle. The darker the spot is, the larger its intensity. (D, Top) Time series of images for the boxed spot in C. (D, Bottom) Intensity trace for the same spot using a 1,000-frame average. We discuss the relationship between intensity and number of bound proteins, as well as how we calculate the spot intensity, in Materials and Methods and SI Appendix.

