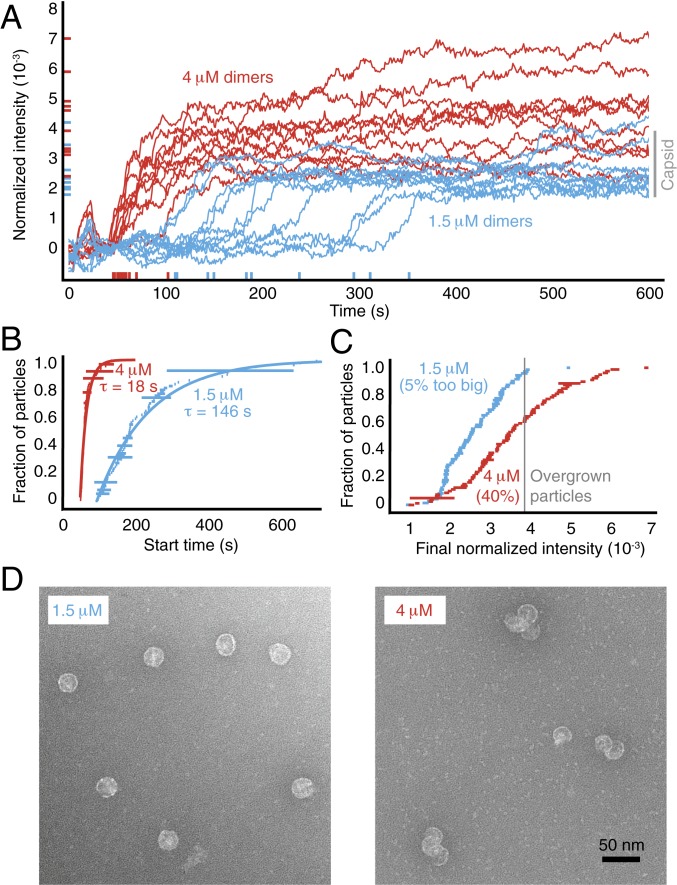
Fig. 3.
Assembly kinetics at different protein concentrations. (A) Intensity traces for 10 randomly chosen particles at 1.5-M and 4-M coat-protein dimers. (B) Cumulative distributions of the start times show that the rate of nucleation increases with protein concentration. The data are fitted by an exponential with a characteristic nucleation time , as described above. The length of each horizontal bar represents the uncertainty in each time measurement. (C) Cumulative distributions of the final intensities show that the fraction of overgrown particles increases with protein concentration. The length of each horizontal bar is the SD calculated from the last 50 s of each trace. (D) TEM images of particles assembled around untethered RNA. At 1.5 M protein (Left), most particles appear to be capsids. At 4 M protein (Right), many particles are clusters of partial capsids.

