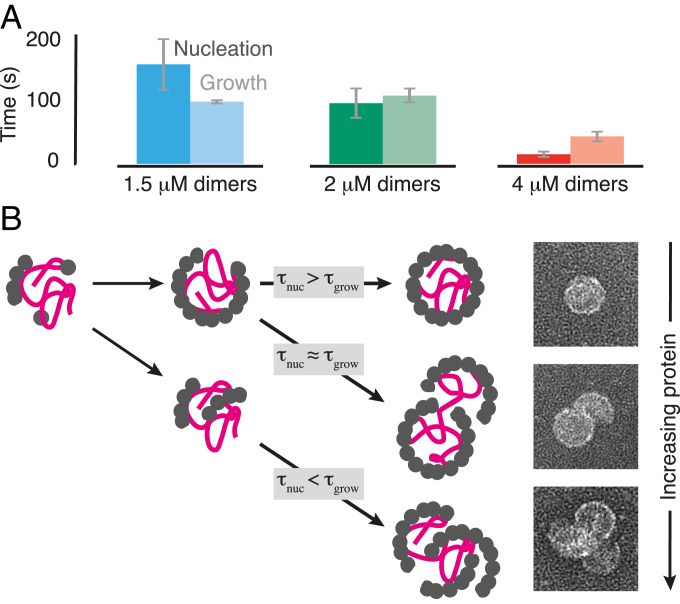
Fig. 4.
Relative timescales of nucleation and growth and the inferred assembly pathways. (A) Measured nucleation times () and median growth times () at different protein concentrations. Error bars represent the SD from 3 replicate experiments. (B) Cartoon of the inferred assembly pathways. At low protein concentration, is large compared to , and a nucleus of coat proteins forms on the RNA and then grows into a proper capsid. At moderate protein concentration, is comparable to , and a second nucleus can form on the RNA before the first one has finished growing, leading to an overgrown structure consisting of a nearly complete capsid attached to a partial capsid. At high protein concentration, is smaller than , and multiple nuclei can form and grow, leading to an overgrown structure consisting of many partial capsids. Example TEM images of the endpoints of each pathway are shown at Right.

