Fig. 3.
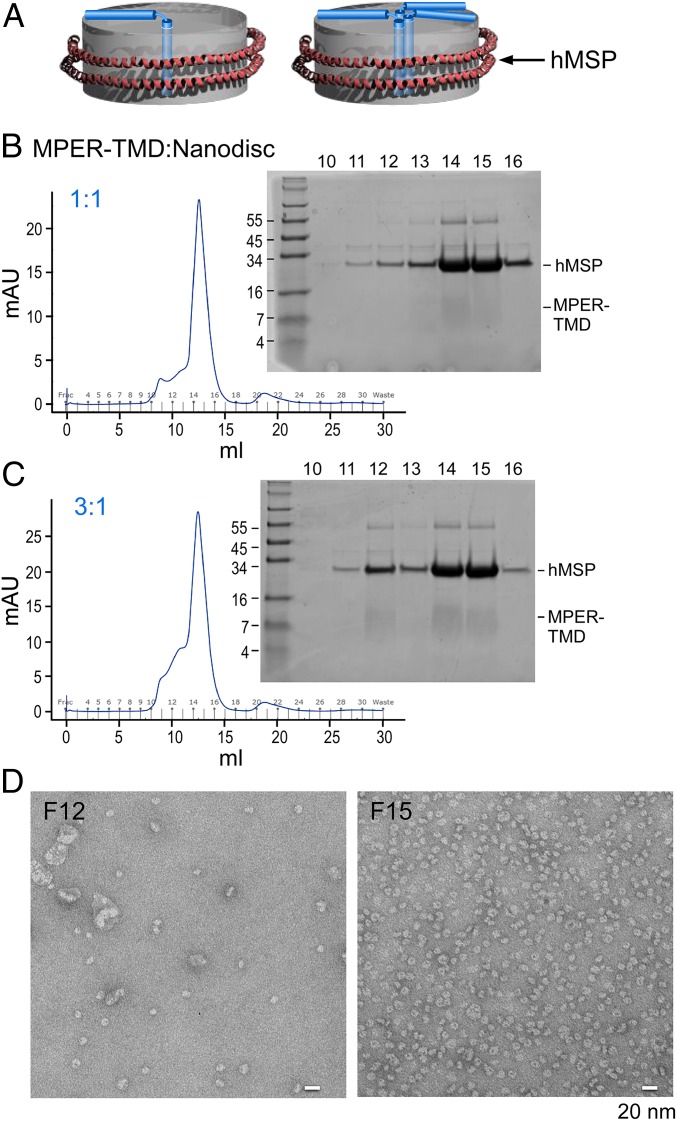
MPER-TMD ND assembly. (A) Models of MPER-TMD in NDs in monomeric (Left) versus trimeric (Right) configurations. The MPER-TMD segment is simplified for illustration purposes and does not imply any precise structural and membrane-immersion information. (B and C) MPER-TMD was assembled into NDs as 1:1 (B) and 3:1 (C) MPER-TMD segment to ND ratios. In both, peptides were first codried with POPC:POPG (3:2), and then the mixture was solubilized and incubated with MSP. After dialysis, the assembled mixture was purified by size-exclusion column and peak corresponding fractions were analyzed on tricine SDS/PAGE gels with positions of hMSP and MPER-TMD relative to molecular weight markers given. (D) Minor peak at fraction 12 and major peak at fraction 15, both from C, were visualized by negative-stain EM. (Scale bar, 20 nm.)

