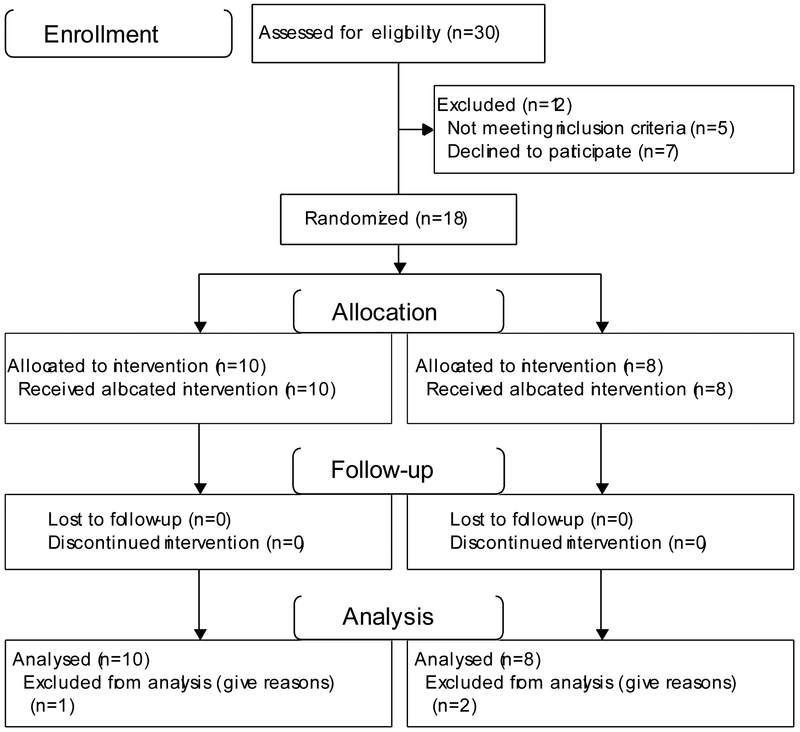
Figure 1.
CONSORT flow diagram.
Flow diagram including enrollment, intervention allocation, follow-up, and data analysis. n=1 excluded from the pressure flow study analysis of the placebo group due to an inability to void, and n=2 excluded from the cystometry analysis of the lidocaine group due to issues with the infusion catheter.

