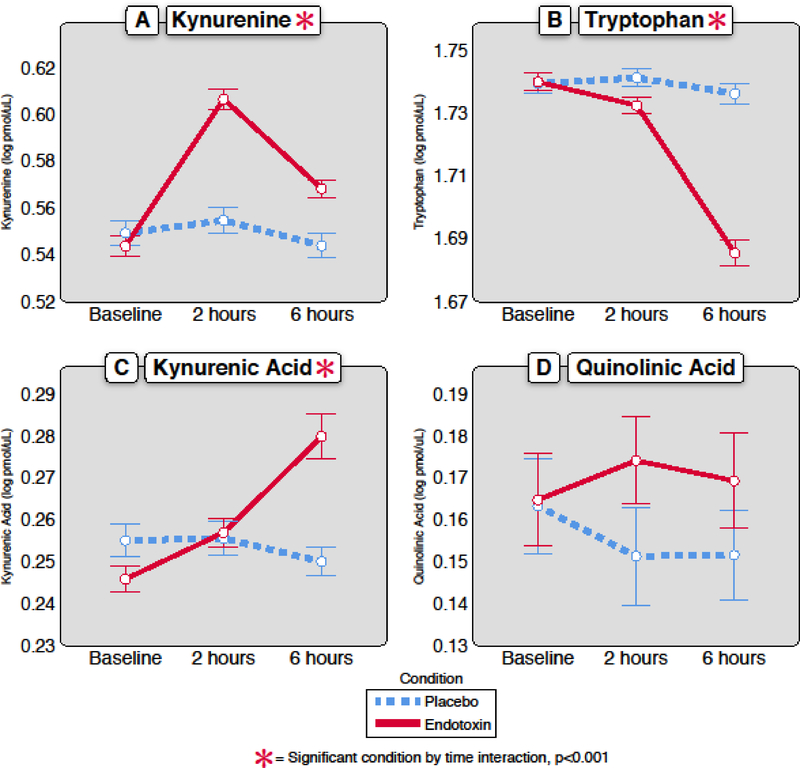
Figure 1. Change in kynurenine pathway metabolites over time in response to endotoxin versus placebo.
In response to endotoxin (n=61), there was a significant change in the plasma concentration of A) kynurenine [F(2,182.36)=26.50; p <0.001], B) tryptophan [F(2,153.35)=50.70; p <0.001], and C) kynurenic acid [F(2,157.62)=12.55; p <0.001], but not D) quinolinic acid [F(2,170.10)=0.55; p= 0.58]. All units for the analytes are in log pmol/μL. Error bars are +/− 1 SE.

