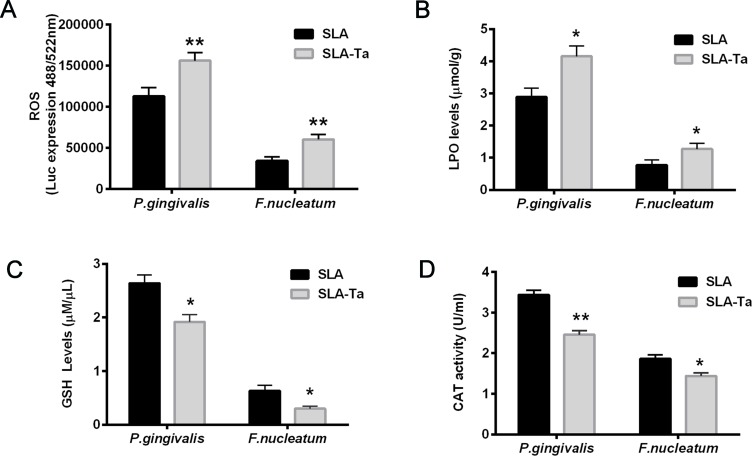
Figure 5.
The fluorescence intensities of ROS (A), LPO levels (B), GSH levels (C) and CAT activities (D) of P. gingivalis and F. nucleatum co-cultured with SLA/SLA-Ta samples for 24hrs. *P<0.5, significantly different from the control SLA group. **P<0.01, significantly different from the control SLA group.
Abbreviations: ROS, reactive oxygen species; LPO, lipid peroxidation; GSH, glutathione, CAT-catalase.

