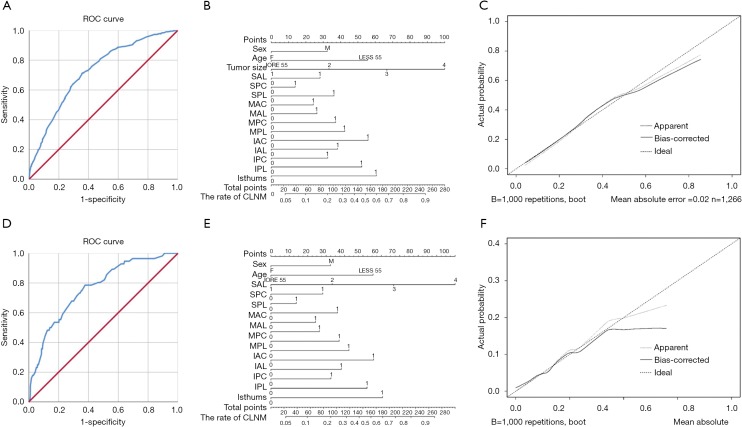
Figure 2.
The ROC curve, nomogram and calibration curve of the 3D localization. (A) The ROC curve to evaluate the predictive value of CLNM; (B) the nomogram to evaluate the risk of CLNM; (C) the calibration curve to evaluate the predictive value of the nomogram about CLNM; (D) the ROC curve to evaluate the predictive value of LLNM; (E) the nomogram to evaluate the risk of LLNM; (F) the calibration curve to evaluate the predictive value of the nomogram about LLNM.

