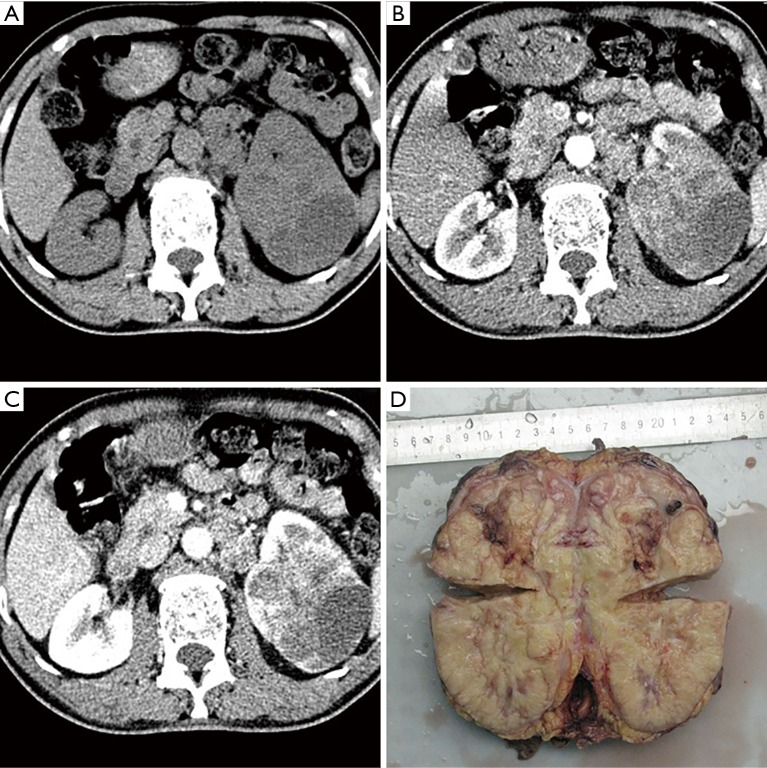
Figure 1.
CT and gross specimen images of tumor. (A) Unenhanced axial CT image shows a large multilobulated mass in the interpolar region of the left kidney; (B) corticomedullary axial CT image shows the tumor with areas of necrosis, varying degrees of irregular enhancement; (C) nephrogenic axial CT image shows a sign of tumor thrombus extends into main left kidney vein invasion; (D) gross specimen of diseased tissue. CT, computed tomography.

