
Fig. 4.
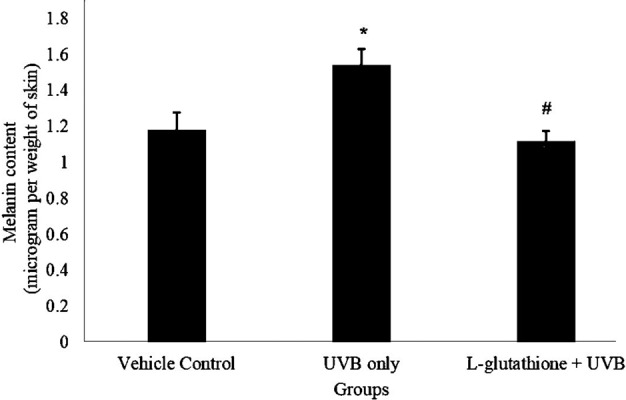
Determination of melanin content in ultraviolet B (UVB)-irradiated mice. The bar chart shows the results for the melanin level in the different groups presented as the mean ± SEM; n=6. *Statistically significant difference in comparison with vehicle control group (P<0.05). #Statistically significant difference in comparison with UVB-exposure group (P<0.05).