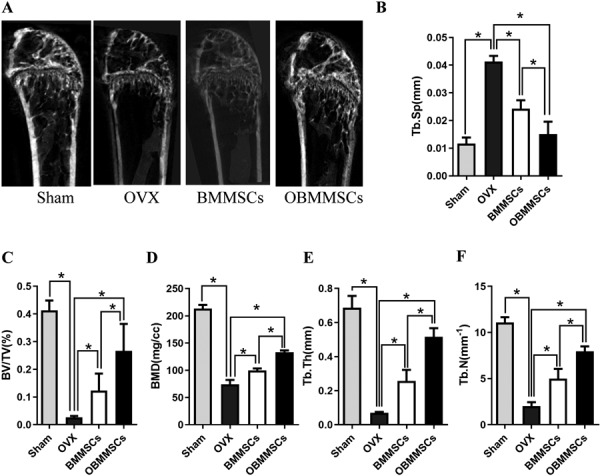
Fig. 2.

Therapeutic outcome of osteoporosis with bone marrow mesenchymal stem cells (BMMSCs) and osthole-treated-BMMSCs (OBMMSCs). (A) Micro-CT analysis of trabecular bone mass in the femora of mice in each group one month later after injection. Quantitative analysis was performed including (B) trabecular spacing (Tb. Sp), (C) trabecular bone volume (BV/TV), (D) bone mineral density (BMD), (E) trabecular thickness (Tb. Th), and trabecular number (Tb. N). Data were analyzed by one-way ANOVA. Results are presented as means ± SD, *P<0.05.
