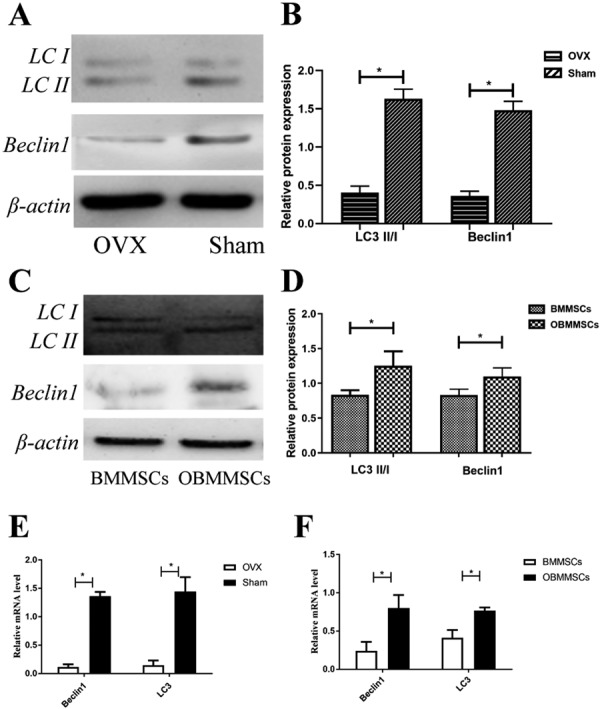
Fig. 4.

Autophagy level in bone marrow mesenchymal stem cells (BMMSCs) and osthole-treated-BMMSCs (OBMMSCs). (A, B) Western blot was performed to examine expression of Beclin1 and LC3 in the ovariectomy (OVX) and Sham group at protein level. (E) Real-time PCR was performed to detect the mRNA expression of Beclin1 and LC3. (C, D, F) Expression of Beclin1 and LC3 in BMMSCs and OBMMSCs at protein and mRNA level was also observed. Data were analyzed by Student’s t-test. Results are presented as means ± SD, *P<0.05.
