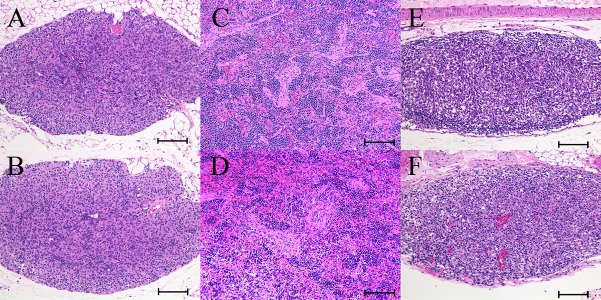
Fig. 3.
Representative histology images of the lymphoid tissues. Image A, C and E were from male NOG mice and image B, D and F were from male NSG mice, 11 weeks of age. (A) and (B) Thymus. Severe lymphoid depletion with disappearance of the cortico-medullary junction. Bar=100 µm. (C) and (D) Spleen. Severe lymphoid depletion with loss of normal architectures of the white pulp and marginal zone. Bar=100 µm. (E) and (F) Mesenteric lymph node. Severe lymphoid depletion with loss of normal cortical and medullary architectures. Bar=100 µm. H&E stain. There was no histological difference in each tissue between NOG and NSG mice.

