
. 2019 Aug 29;7(4):250–257. doi: 10.1002/iid3.267
© 2019 The Authors. Immunity, Inflammation and Disease Published by John Wiley & Sons Ltd.
This is an open access article under the terms of the http://creativecommons.org/licenses/by/4.0/ License, which permits use, distribution and reproduction in any medium, provided the original work is properly cited.
Figure 1.
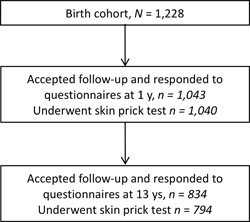
Flow chart of the study population