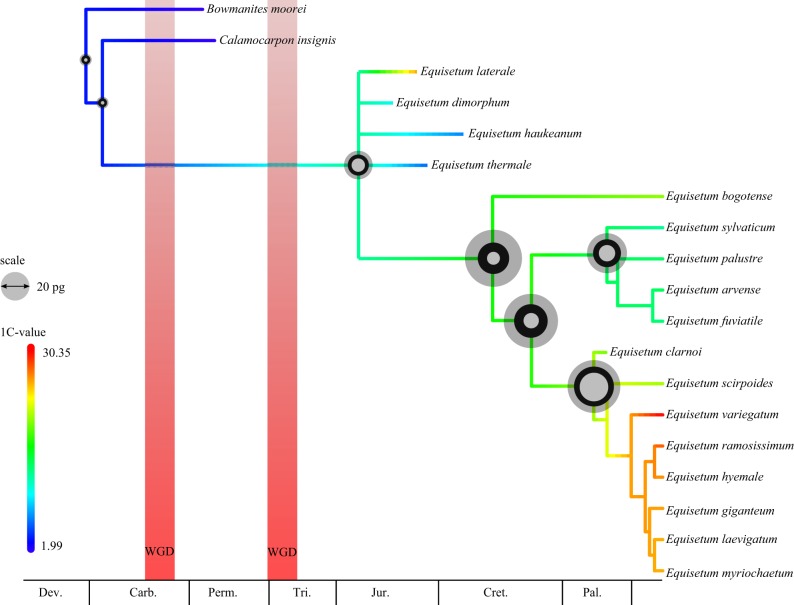
Figure 6.
The reconstruction of ancestral genome size across the Equisetales. The genome size was reconstructed based on both extant and fossil 1C-value estimates. The reconstructed size is shown at each node, with the width of the circle proportional to the 1C-value. The middle circle represents the mean estimate, while the small and large circles represent the lower and upper 95% HPD values, respectively. Branches are coloured to show the evolution of large (red) and small (blue) genome sizes. (Online version in colour.)

