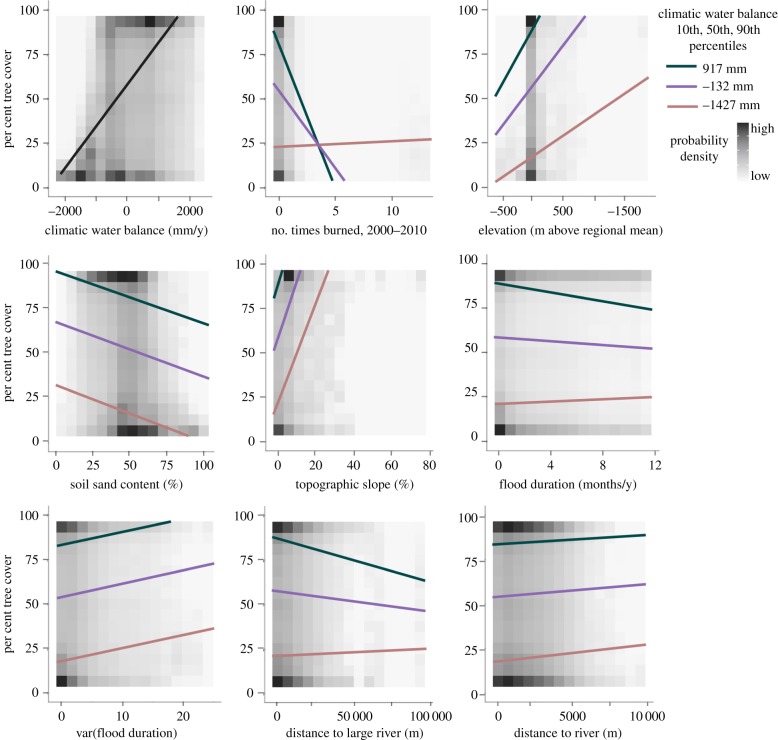
Figure 3.
Conditional regression plots for linear models of floodplain tree cover across 13 floodplain ecosystems (‘global’ linear model). Model-predicted tree cover is plotted for x-variable values at the 10th, 50th and 90th percentile of climatic water balance (red, purple and green lines online; top, middle, and bottom lines at left of each panel in hard-copy). Note the often-weaker effects (shallower slopes) in drier ecosystems. Predictors not plotted in each panel are held constant at their medians. Ninety-five per cent confidence intervals are all thinner than the regression lines. Plot backgrounds show the relative density of tree cover observations and plots are ordered by global variable importance.

