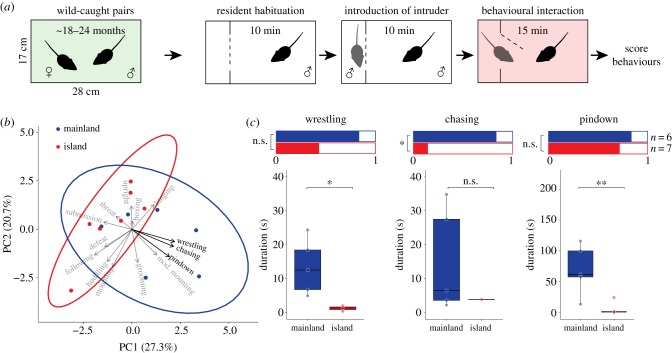
Figure 4.
Territorial aggression in wild-caught island and mainland mice. (a) Schematic of the behavioural assay. (b) PCA of the duration of wild-caught resident behaviours. Ellipses represent 95% confidence intervals. Arrow directions indicate how behaviours contribute to the two PCs, and arrow lengths are proportional to the strength of contribution. Behaviours highlighted in bold were selected for additional analysis. (c) Aggressive behaviour in wild-caught founder mice. Bar graphs (top) show the proportions of mice engaging in wrestling, chasing and pindown behaviours. Boxplots (bottom) show the duration of each behaviour for those individuals that engaged in that behaviour. Sample sizes are provided. See Methods for statistical details. n.s., not significant; *p < 0.05, **p < 0.01. (Online version in colour.)

