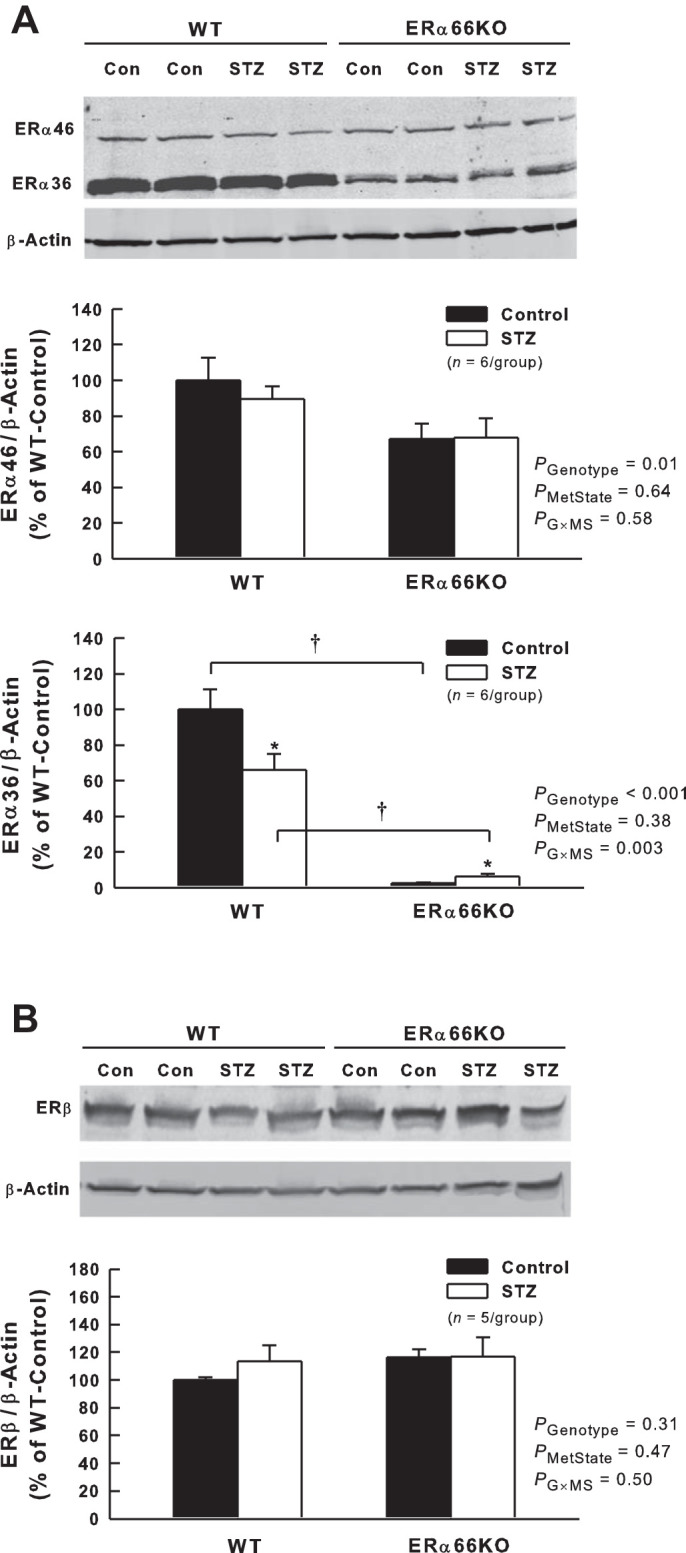
Fig. 1.

Effects of type 1 diabetes (T1D) and loss of estrogen receptor (ER)α66 on ERα splice variant and ERβ protein expression in renal cortex. A: representative Western blot and quantification of ERα46 and ERα36 protein levels. B: representative Western blot and quantification of ERβ protein levels. P values shown are main effects determined by 2-way ANOVA. Note: ERα36 data required transformation (loge) to satisfy ANOVA assumptions. *P < 0.05 vs. Control (Con) of same genotype; †P < 0.05, comparing the same metabolic state in different genotypes.
