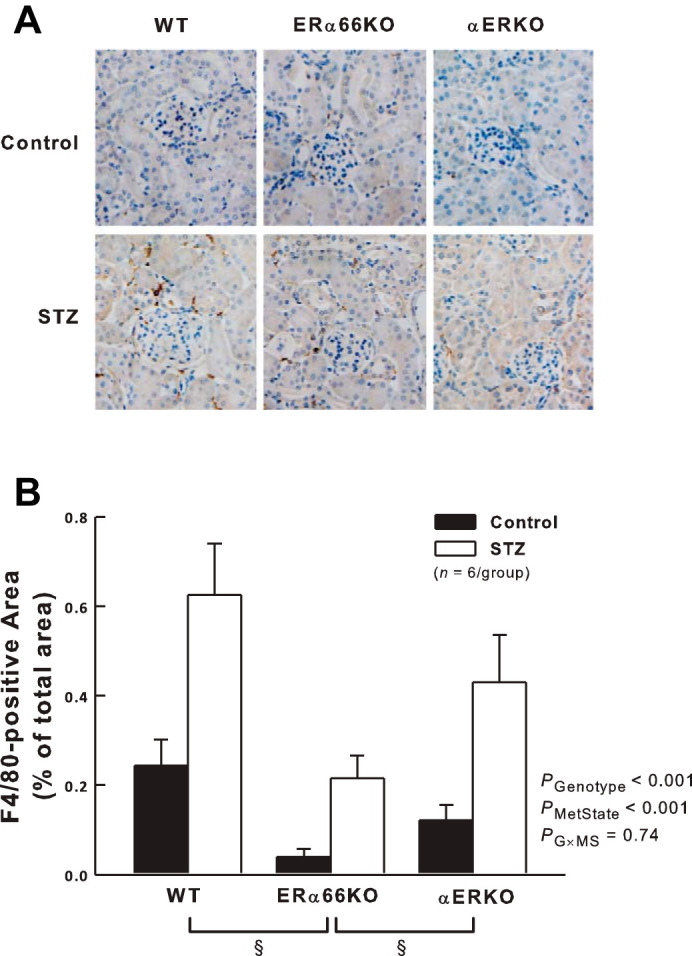
Fig. 6.

Effects of T1D and ER genotype on renal cortical interstitial macrophage infiltration. A: representative renal immunohistochemistry showing F4/80-positive macrophages in dark brown. B: quantification of F4/80-positive cells in kidneys from each group of mice. P values shown are main effects determined by 2-way ANOVA, after transformation (square root) to satisfy ANOVA assumptions. *P < 0.05 vs. Control of same genotype. §P < 0.05 across genotypes.
