Fig. 4.
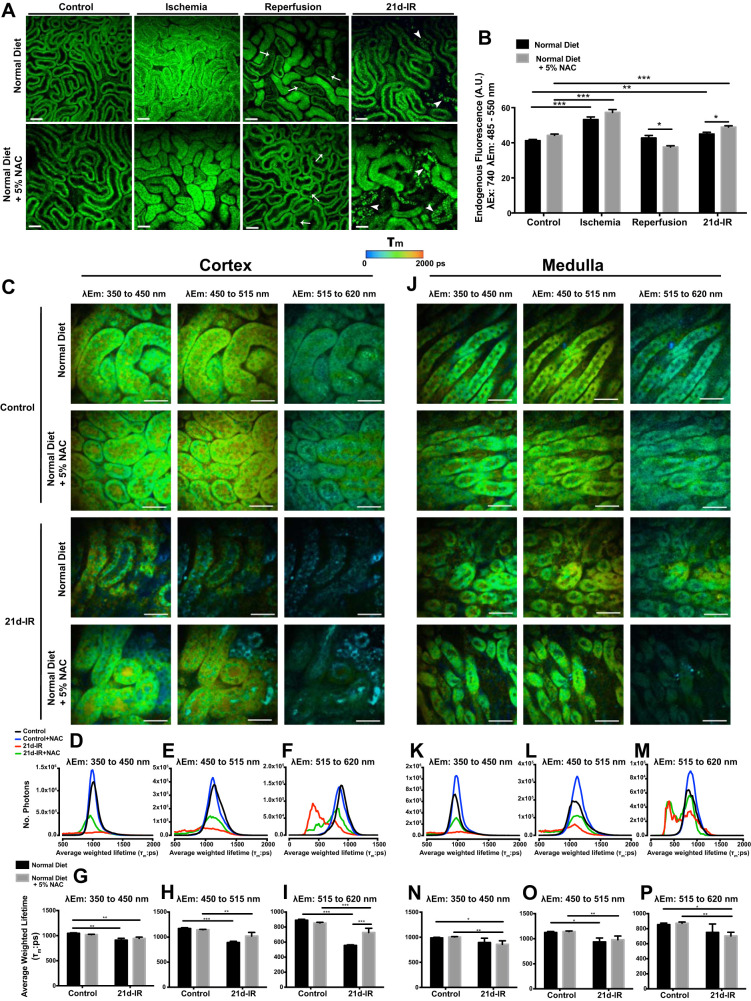
Intravital multiphoton microscopy (MPM) and fluorescence lifetime imaging (FLIM)-MPM demonstrate metabolic and structural alterations in chronic kidney pathology following AKI that is not attenuated by NAC. A: endogenous fluorescence, excited at 740 nm, in healthy control kidney cortex demonstrates the cortical tubular network with distal tubules, proximal tubules with associated brush border, and interstitial space that was unaltered in mice fed NAC diet. B: during 20-min ischemia, tubular swelling and a reduction in interstitial space was evident in both normal and NAC diet and was associated with a significant increase in tubular cell NAD(P)H endogenous fluorescence. Tubular and cellular damage was observed at the early stages of reperfusion (5- to 40-min IR), indicated by epithelial cell striations, cell effacement and the formation of cast material with either diet (A). At 21-days following IR injury (21d-IR), there was widespread tubular atrophy (arrowhead). Tubular structure was highly variable with structurally normal tubules appearing within areas of atrophy, perhaps allowing crosstalk between damaged tubules. There was a significantly greater endogenous fluorescence signal in the normal-looking tubules for normal and NAC diet (B). Results are expressed as means ± SE tubular epithelial cell fluorescence a 740 nm (3 random fields analyzed per kidney; n = 4–6 animals per group; *P < 0.05, **P < 0.01, ***P < 0.001 compared as indicated). Scale bar represents 50 µm. FLIM with chronically damaged mouse kidney are presented in C–P for cortex and medulla. Representative average-weighted fluorescence lifetime (τm) images for autofluorescent species in three spectral ranges are presented for cortex and medulla of control and 21d-IR mice on a normal diet or a normal diet + 5% NAC (NAC diet). Fluorescence lifetime data were measured within three spectral ranges (pseudocolor range from blue-red indicated in color bar): 350 to 450 (750 to 1,500 ps) to capture NAD(P)H, 450 to 515 (1,000 to 1,750 ps) to capture NAD(P)H/FAD, and 515 to 620 nm (500 to 1,750 ps) to capture FAD. The τm lifetime histograms, representing the average pixel intensity for each τm lifetime, are shown for cortex (G–I) and medulla (N–P). The corresponding average τm lifetimes from the three spectral channels are charted for control and 21d-IR cortical slices (D–F) and medullary slices (K–M). The τm lifetime histograms demonstrate decreased pixel intensity for 21d-IR kidneys in the cortex and medulla regardless of diet and within all three spectral channels. An observable left shift is apparent in 21d-IR kidney cortex compared with control kidneys, which is more pronounced in mice on a normal diet (D–F). The τm detected in all three spectral channels was significantly decreased in the cortex of 21d-IR kidneys compared with respective control kidneys, regardless of diet, and this was enhanced for 515–610 nm in mice on a normal diet. In the medulla, only mice on the NAC diet had a significantly reduced τm detected in the 350–450 and 515–620 nm channels at 21d-IR (J–M). The 450–515 nm channel detected a decreased τm in the medulla of the 21d-IR kidney regardless of diet. Results are expressed as means ± SE (*P < 0.05, **P < 0.01, ***P < 0.001 compared as indicated). Scale bar represents 30 µm.

