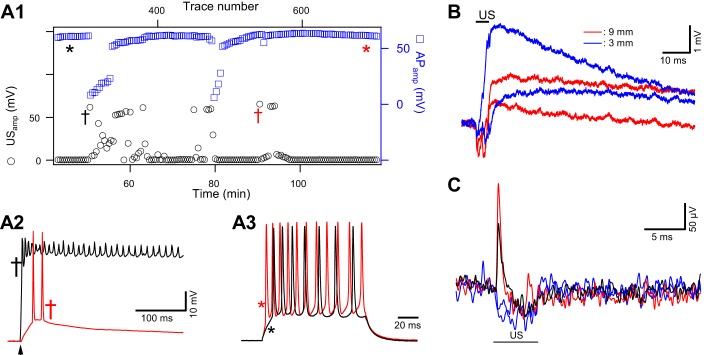
Fig. 2.
Stochastic nature of ultrasound (US)-induced responses and assessment of functional integrity of motor axons exposed to repeated 5-ms US tone bursts. A: test of action potential (AP) stability and axon viability during US-induced responses. A1: timeline plot of amplitudes of US induced depolarizations (USamp, black circles) from an inhibitory axon. Plot illustrates the stochastic and clustering nature of the responses. Axonal excitability was tested with suprathreshold current steps, inserted between US tone burst deliveries. AP amplitudes (APamp, blue squares), measured from resting membrane potential, remained constant except during the periods in which US induced prolonged depolarizations and reduced membrane resistance. The US tone burst, 5 ms at 2.1 MHz and 6.5 mW/cm2, was delivered at a rate of 0.1 Hz. x-Axes include trace number (top) and corresponding time (bottom). The same current injection amplitude (15 nA) was used over the entire experimental period. A2: 2 representative examples of US-induced depolarizations. Red and black traces correspond to the times marked by the daggers of matched colors in A1. Arrowhead indicates the timing of US delivery. A3: 2 representative examples of current step-induced AP trains, corresponding to the time points marked with asterisks in A1. APs were initiated by current injection at the primary branch and recorded at a secondary branching point. There was a slight increase in the number of APs over time (red), suggesting a slight increase in input resistance. There was no channel blocker in this preparation. A2 and A3 share the same vertical scale. B: depolarizations recorded from an axon where US focal points were displaced away from the recording electrode. Depolarizations were recorded from the primary branching point. The proximal part of the axon in this preparation had been preserved, ~10 mm in length. Depolarizations were still detected when the US transducer was moved horizontally along the axon by 3 mm (blue) and 9 mm (red) away from the primary branching point. Two traces are shown for each location to demonstrate the consistency of evoked responses. US delivery time is indicated by the black bar. US intensity was 8.9 mW/cm2. C: extracellular recordings, at 5 kHz filtering, uncovered transients coinciding with the onset of US bursts. US burst duration was 5 ms and intensity 9.0 mW/cm2. These events were rare, occurring in 2 of 55 trials. Red and black traces represent 2 examples of US-positive responses, and blue traces represent US-negative responses. Data in A, B, and C were obtained from different preparations.

