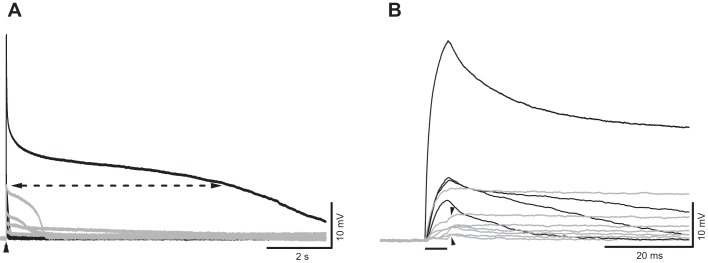
Fig. 3.
Variations in ultrasound (US)-induced membrane responses. A: US responses recorded from an axon treated with tetrodotoxin (1 µM), 4-aminopyridine (200 µM), and ZD7288 (50 µM). Recordings were obtained from 2 different clusters of US-induced responses, in black and gray, respectively. Arrowhead indicates US delivery time. Dashed line identifies the 25% level of the peak amplitude of the largest response, as an example of how duration measurements were made. B: same traces as in A but displayed in an expanded timescale. Horizontal bar indicates timing of the US burst. Arrowheads indicate that additional depolarization can occur at the end of US bursts. Intensity of spatial peak temporal average = 8.1 mW/cm2.

