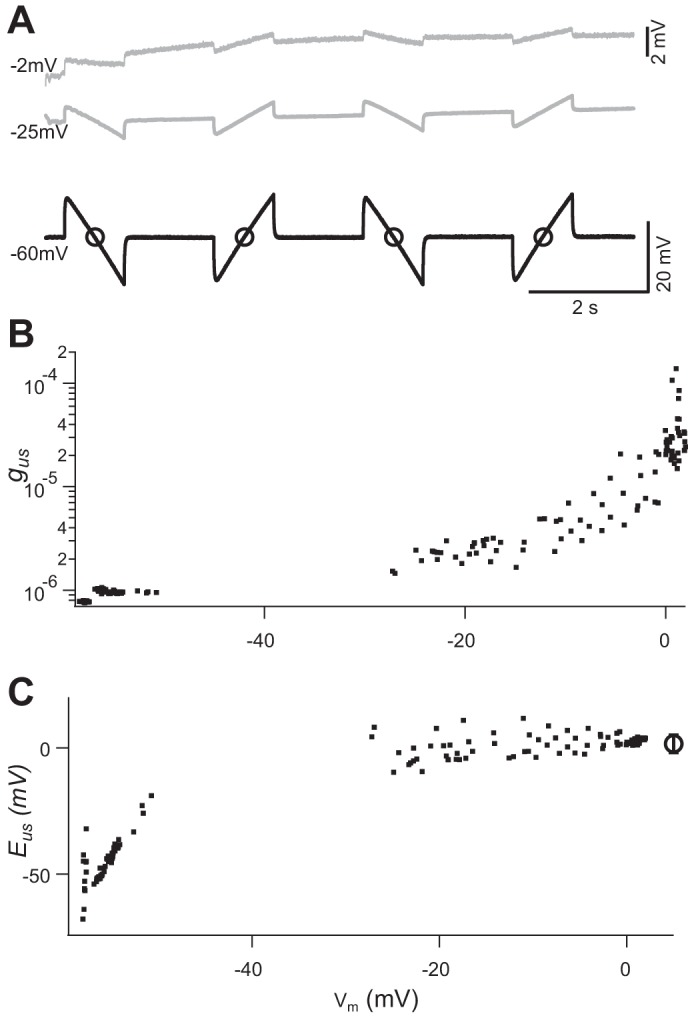
Fig. 7.

Estimate of reversal potential and conductance changes induced by ultrasound (US). A: recordings obtained during a prolonged (240 s) episode of US-induced depolarization. Four current ramps were delivered during each 10-s trace. Black trace was recorded from a trial in which US burst induced no depolarization. Two gray traces were recorded during different stages of recovery from a large US-induced depolarization. Circles on black trace identify the time point when membrane potential (Vm) and membrane conductance were measured. Vm at which the traces were recorded is indicated on left of each trace. Top trace was amplified by a factor of 4 (see calibration on right), to highlight the responses induced by current ramps. B and C: US-induced conductance (gus; B) and reversal potential (Eus; C) calculated from Eqs. 1 and 2 and plotted against Vm. Circle and error bar on right in C represent the mean and SD of the Eus values estimated when Vm was above −30 mV. All recordings were obtained in the presence of tetrodotoxin (1 µM), 4-aminopyridine (200 µM), and ZD7288 (50 µM). Intensity of spatial peak temporal average = 7.0 mW/cm2
