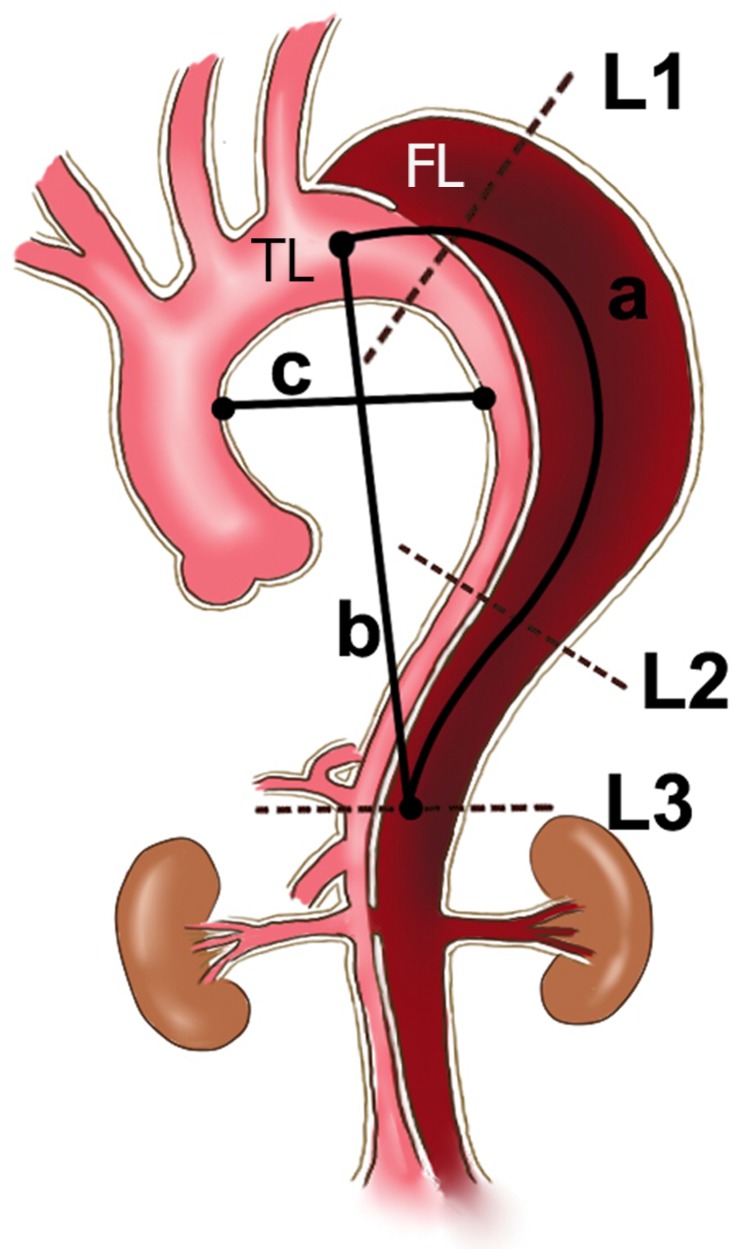
Figure 1.
Schematic diagram showing the TL, FL and ML area measured directly at the L1, L2 and L3 (dotted lines) levels and the measurements of TI (a/b) and RoC (c/2).
Notes: Level 1: the bronchial bifurcation level; Level 2: the lower edge of the left atrium level; and Level 3: the level of the celiac trunk; a, intra-aorta centerline length between the left subclavian artery and celiac trunk; b, linear distance between the left subclavian artery and celiac trunk; c, distance from the inner wall of the ascending aorta to the inner wall of the descending aorta at the level of the pulmonary artery.
Abbreviations: TL, true lumen; FL, false lumen; ML, maximal lumen; TI, tortuosity index; RoC, radius of curvature.

