
Fig. 5.
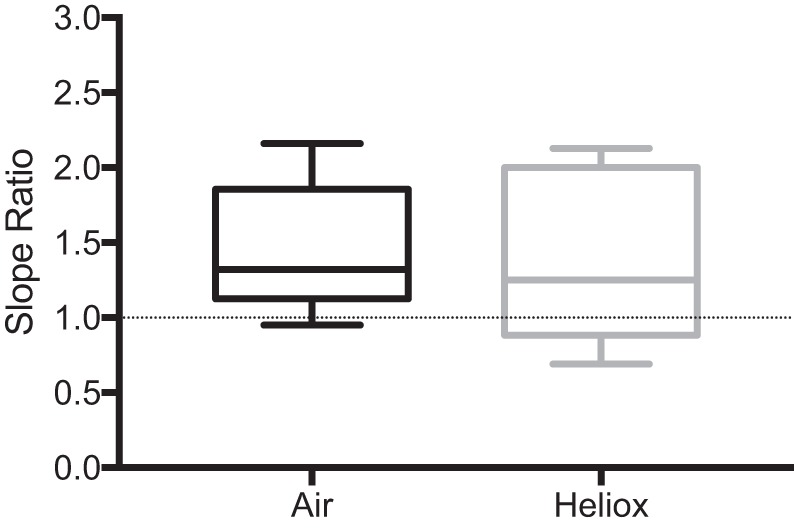
Box and whisker plot of mean slope ratio (SR) data for a subset (n = 10) of preterm without bronchopulmonary dysplasia (PRE) and bronchopulmonary dysplasia (BPD) subjects while breathing air and heliox. Line in the middle of the box denotes the median SR value for each group. Box extends from the 25th (bottom) to the 75th (top) percentiles. Whiskers extend to the minimum and maximum values within each group.