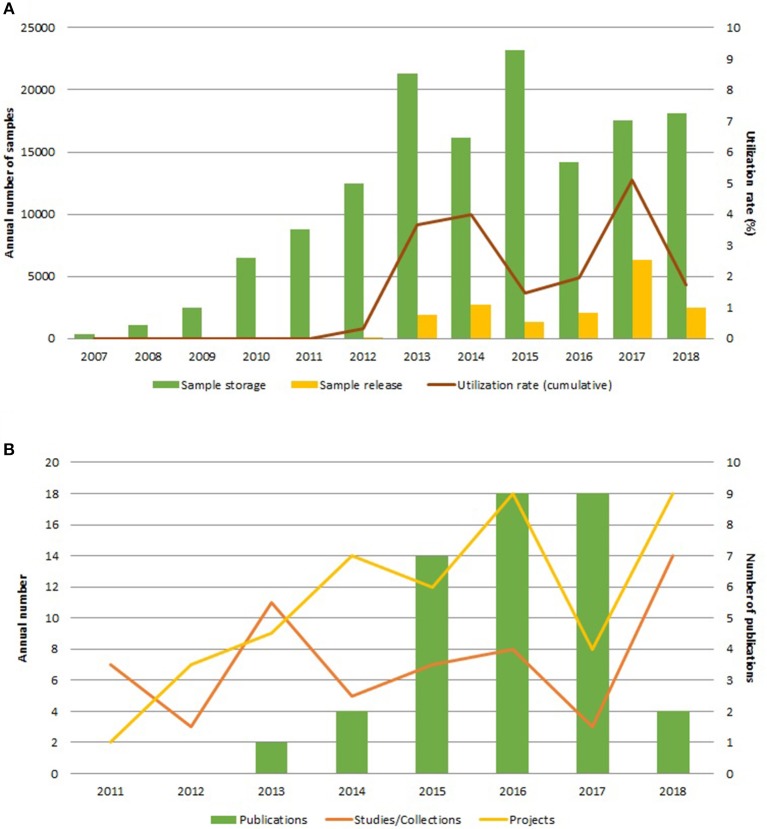
Figure 4.
Overview of the sample-based activities, cumulated for all sample collections of UBiLim. (A) Annual number of samples stored (green bar) and released (yellow bar) and annual utilization rate of samples (brown line, displayed on secondary Y-axis). (B) Annual number of studies/collections setup (orange line) and projects for sample use started (yellow line) by UBiLim and annual number of publications using samples derived from UBiLim (green bars, displayed on the secondary Y-axis).

