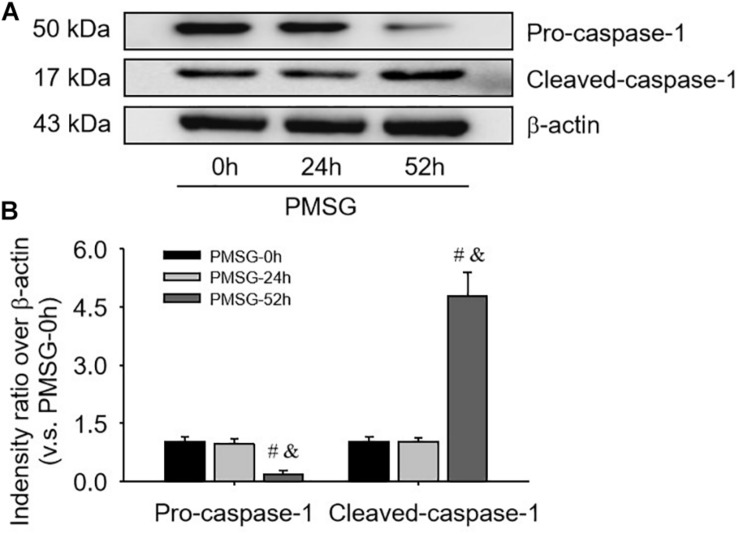
FIGURE 4.
Pro-caspase-1 and cleaved-caspase-1 protein expressions in the ovary during the follicular development induced by PMSG. (A) Representative ECL gel images of Western blot analyses depicting the pro-caspase-1 and cleaved-caspase-1 protein levels. (B) Summarized intensities of pro-caspase-1 and cleaved-caspase-1 blots normalized to the control. Each value represents the mean ± SE. One-way analysis of variance (ANOVA) was used to analyze the data, followed by a Tukey’s multiple range test. n = 6. #P < 0.05, vs. PMSH-0 h; &P < 0.05, vs. PMSH-24 h.

