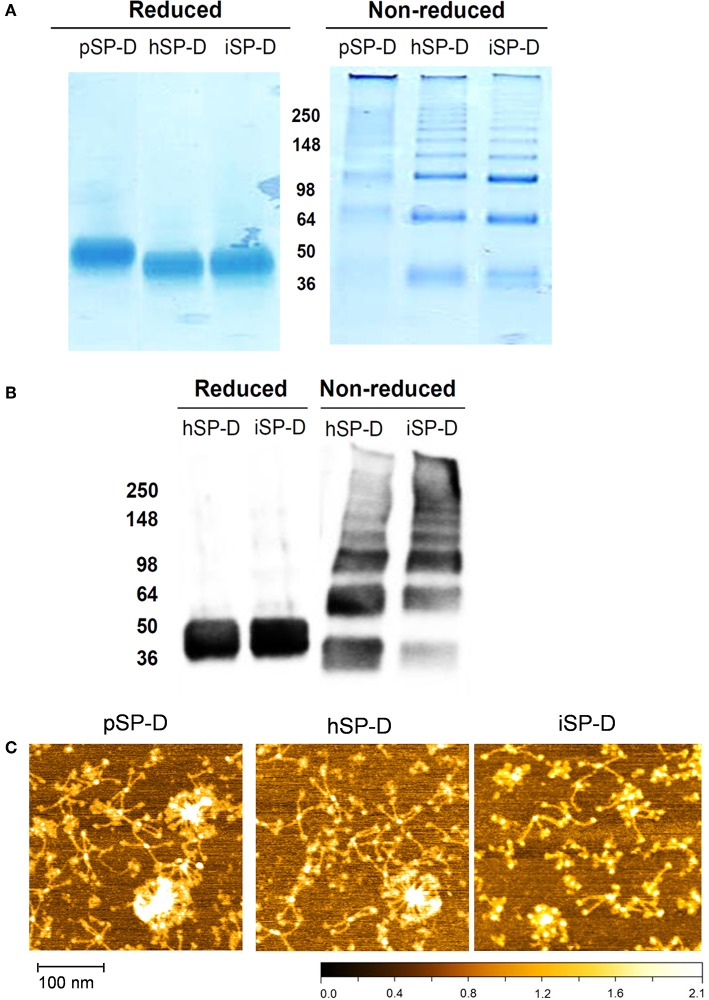
Figure 2.
Characterization of iSP-D and comparison with other SP-Ds. (A) Reducing (left) and non-reducing (right) SDS-PAGE (12%) and Coomassie staining of purified full-length SP-Ds. (B) Western blot analysis of reduced and non-reduced hSP-D and iSP-D, followed by immunodetection with rabbit anti-human SP-D antibodies and goat anti-rabbit HRPO conjugate. The different bands visible in the non-reducing lanes are due to the presence of various oligomeric forms of SP-D that typically occurs upon non-reducing SDS-PAGE analysis of fully assembled SP-D. (C) Analysis of SP-Ds by Atomic Force Microscopy in ambient conditions after deposition on mica and scanning in tapping mode. The high points are colored lighter and lower points darker—full scale, black to white is 2 nm.

