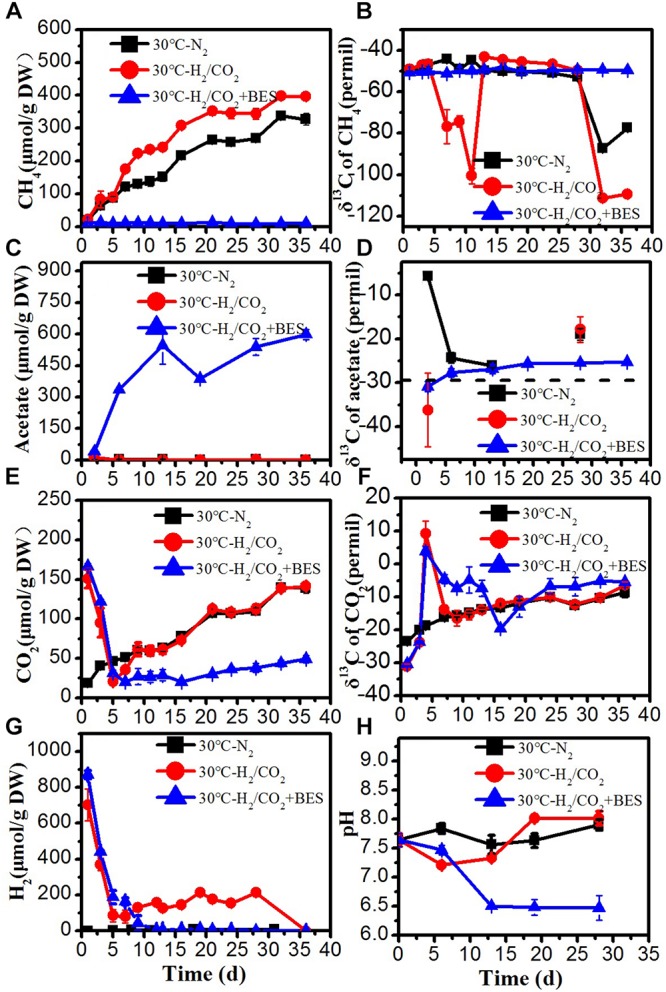
FIGURE 2.

Time course of accumulated (A) CH4, (B) δ13C of CH4, (C) acetate, (D) δ13C of acetate, (E) CO2, (F) δ13C of CO2, (G) H2 concentration, and (H) pH during the treatment of sewage sludge at 30°C, BES as an inhibiter of methanogenesis. The δ13C of the sludge organic matter (−29.8‰) was represented by dotted line. Mean ± SD, n = 3.
