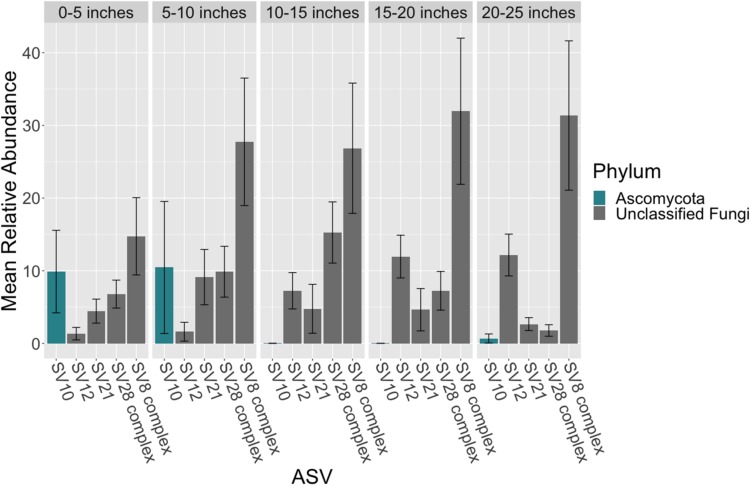
FIGURE 4.
Mean relative abundance of ASVs across leaf length. The mean relative abundance of ASVs with a mean of greater than two percent are shown across leaf segments, 0–5 inches (n = 10), 5–10 inches (n = 10), 10–15 inches (n = 10), 15–20 inches (n = 10) and 20–25 inches (n = 10), with the standard error of the mean represented by error bars and bars colored by taxonomic phylum. The dataset was first subset to a depth of 5,000 sequences per sample and then converted into relative abundance values. ASVs were grouped into complexes if ASVs shared greater than 99% sequence identity. Taxonomy was inferred for ITS2 ASVs using the RDP Naive Bayesian Classifier algorithm with a modified UNITE (v. 8.0) database (Wang et al., 2007; UNITE Community, 2019).

