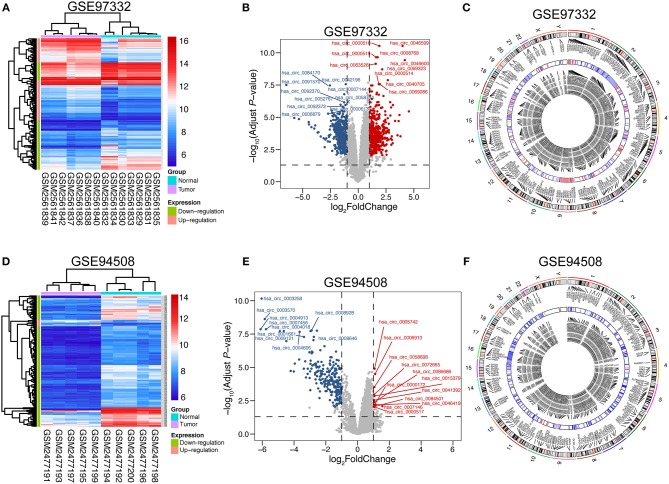
Figure 1.
Differential expression of circRNAs in GSE 97332 and GSE 94508. (A,D) Hierarchical clustering analysis of circRNAs, which were differentially expressed between tumor and normal tissues; GSE 97332 included seven tumor tissues and seven matched non-tumor tissues, while GSE 94508 included 10 paired samples (>2-fold difference in expression; adjusted P < 0.01). Expression values are exhibited in different colors, indicating expression levels above and below the median expression level. (B,E) Volcano plots were constructed using fold-change values and adjusted P. The red point in the plot represents the over-expressed circRNAs and the green point indicates the down-expressed circRNAs with statistical significance. (C,F) Circos plots representing the chromosomal distributions of the differentially expressed circRNAs and their host genes, including the heatmap circle of averaged circRNA expression.

