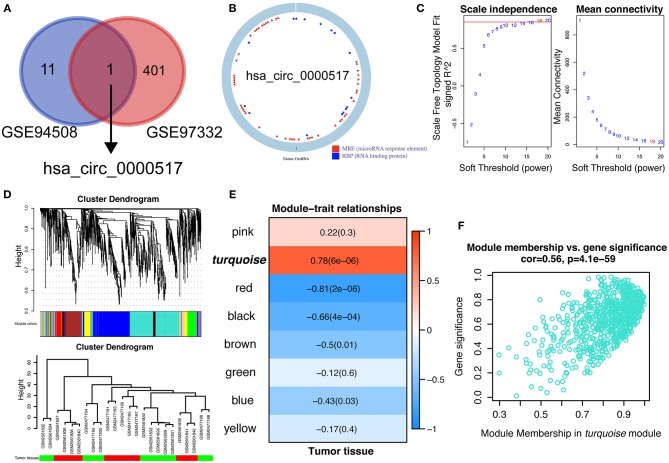
Figure 2.
Identification of hub modules correlated with HCC in the datasets via WGCNA. (A) Comparison of differentially over-expressed circRNAs in both GSE 94508 and GSE 97332. Only hsa_circ_0000517 was overlapped. (B) The structure of hsa_circ_0000517 retrieved from CSCD database (http://gb.whu.edu.cn/CSCD/). (C) Analyses of the Scale-Free Topology Model Fit and the Mean Connectivity for different soft threshold powers. (D) Clustering dendrograms of circRNAs. The clustering was based on the combined data from GSE 97332 and GSE 94508. (E) The correlation between various modules and tumor tissues. The correlation coefficient and P-value were presented in the heatmap. (F) Scatter plot of module membership (circRNAs) in the turquoise module.

