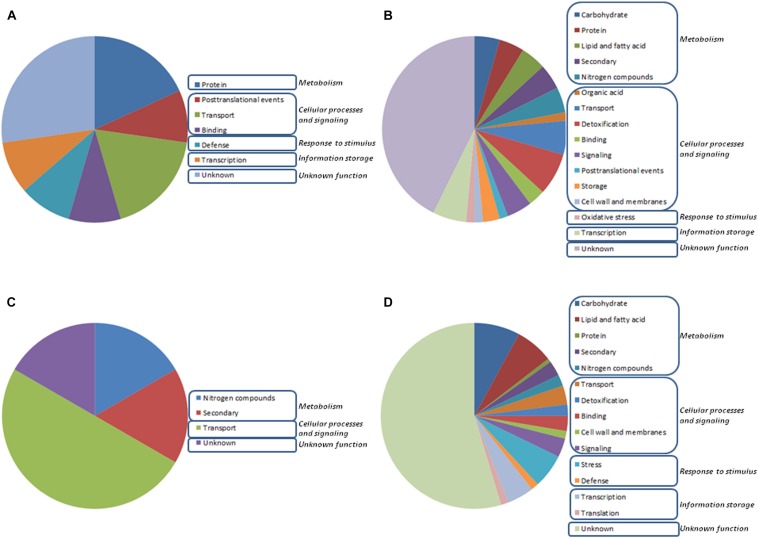
FIGURE 1.
Distribution within physiological processes of the 226 differentially expressed genes at early stage (48 h growth) in wheat seedling roots resulting from the GeneChip Wheat Genome Array analysis is depicted for eight different growth conditions with (T1) or without (T0) Trichoderma harzianum T34 and 0 (N0), 0.1 (N0.1), 0.5 (N0.5) or 1 (N1) mM calcium nitrate. Gene significance was assigned to at least twofold change (P: 0.15). Comparisons were performed between (A) T0N0 and T0N0.5 or T0N1, (B) T0N0 and T1N0, (C) T1N0 and T1N0.5 or T1N1, and (D) T0N0.1, T0N0.5 or T0N1 and T1N0.1, T1N0.5 or T1N1.

