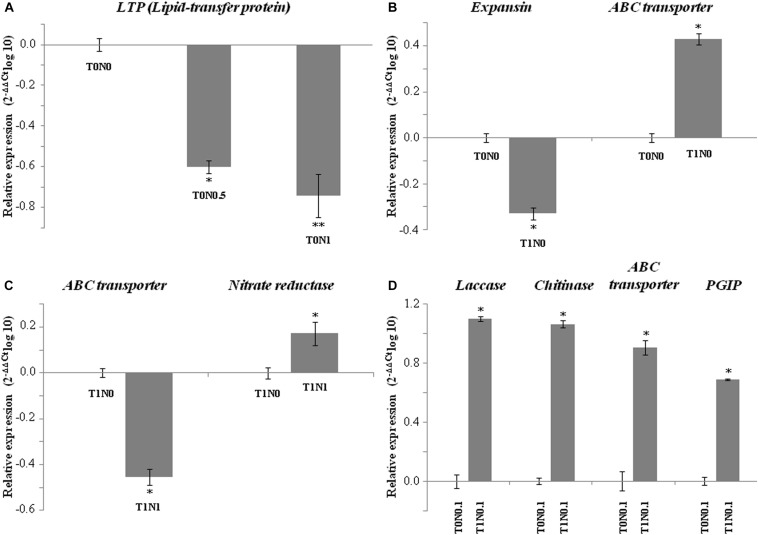
FIGURE 2.
qPCR expression analysis of seven International Wheat Genome Sequencing Consortium (IWGSC, v0.4)-referred genes of a set of 226 genes differently expressed in wheat seedling roots resulting from the GeneChip Wheat Genome Array analysis under eight different growth conditions with (T1) or without (T0) Trichoderma harzianum T34 and 0 (N0), 0.1 (N0.1), 0.5 (N0.5) or 1 (N1) mM calcium nitrate. Analyzed gene code for: (A) Lipid-transfer protein (LTP, ID TraesCS1A01G175200.1) (T0N0.5 and T0N1 compared to T0N0 conditions), (B) expansin (ID TraesCS4A01G034300.1) and ABC transporter (ID TraesCS5A01G016200.1) (T1N0 compared to T0N0), (C) ABC transporter and nitrate reductase (ID TraesCS6B01G024900.1) (T1N1 compared to T1N0), and (D) laccase (ID TraesCS3B01G489800.1), chitinase (ID TraesCS7A01G371600.1), ABC transporter, and polygalacturonase inhibitor (PGIP, ID TraesCS7B01G103900.1) (T1N0.1 compared to T0N0.1). Data are the mean of three technical replicates from two biological replicates and are displayed as the log10 of the relative quantity (RQ, 2– DDCt) of target genes compared with the quantity of actin gene used as a reference. For each biological replicate, roots from ten plants were pooled.

