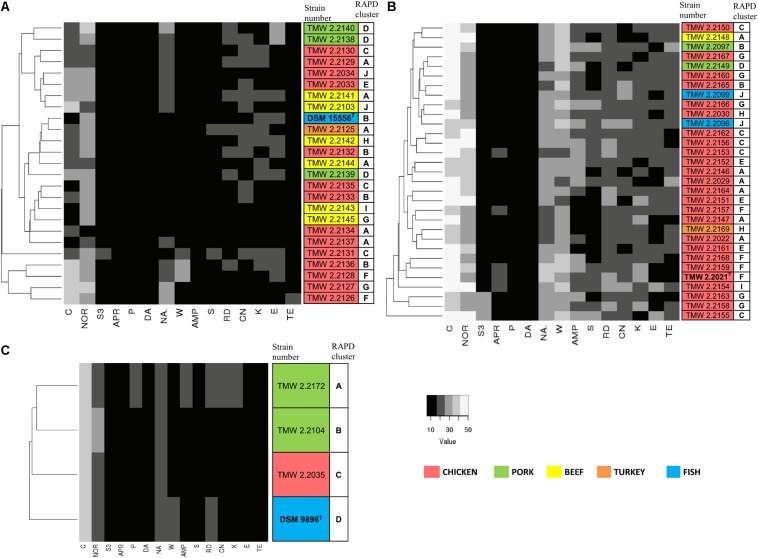
FIGURE 3.
Clustering of the strains by their antibiotic resistance. Resistance was assessed as the diameter of the inhibition zone in mm, with 6 mm being the blank value. C, chloramphenicol (30 μg); NOR, norfloxacin (10 μg); S3, sulfonamides (300 μg); APR, apramycin (25 μg); P, penicillin G (5 μg); DA, clindamycin (2 μg); NA, nalidixic acid (30 μg); W, trimethoprim (5 μg); AMP, ampicillin (10 μg); S, streptomycin (25 μg); RD, rifampicin (5 μg); CN, gentamycin (10 μg); K, kanamycin (30 μg); E, erythromycin (15 μg); TE, tetracycline (30 μg). The different isolation sources are displayed in colors and type strains are marked with bolt letters. (A) P. phosphoreum, type strain DSM 15556T, (B) P. carnosum, type strain TMW2.2021T, (C) P. iliopiscarium, type strain DSM 9896T.

