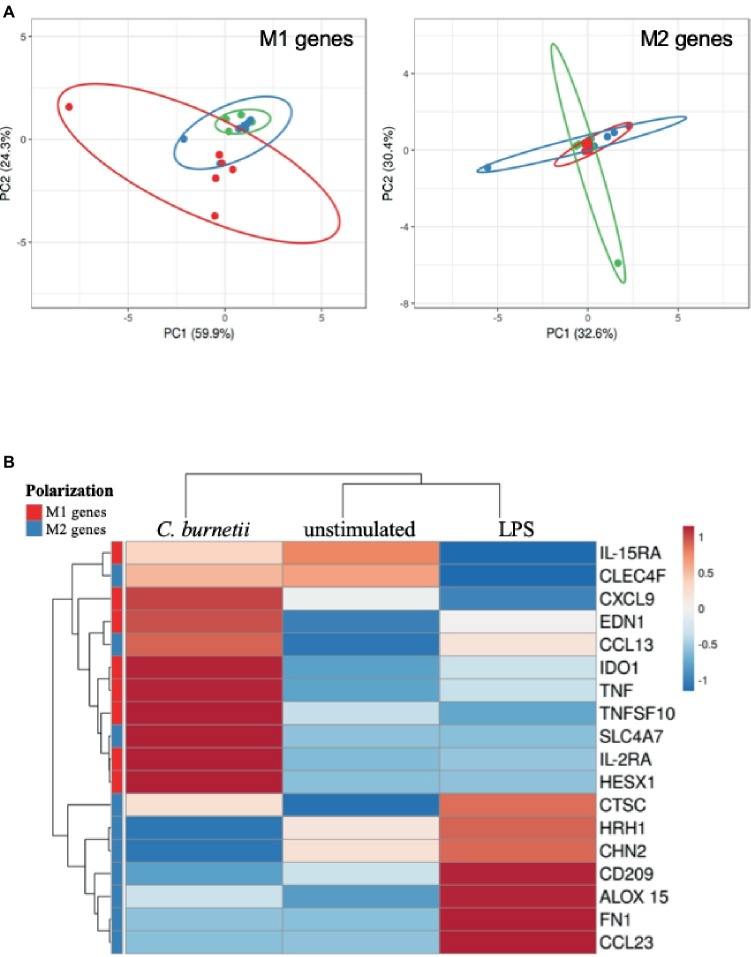
Figure 4.
Polarization profile of placental macrophages stimulated by C. burnetii. Placental macrophages (1 × 10⁶ cells per assay) were incubated with C. burnetii (bacterium-to-cell ratio of 50:1) or 1 μg/ml LPS for 6 h, and their M1/M2 transcriptional response was analyzed by qRT-PCR. (A) A principal component analysis showed the repartition of unstimulated placental macrophages (in green, six placentas), C. burnetii-stimulated (in red, seven placentas), and LPS-stimulated macrophages (in blue, seven placentas) according to the expression of M1 genes (left panel) and M2 genes (right panel). (B) A heat-map analysis showed the modulation of the relative quantity expression of M1 genes (in red) and M2 genes (in blue) when placental macrophages were unstimulated or stimulated by C. burnetii or LPS.

