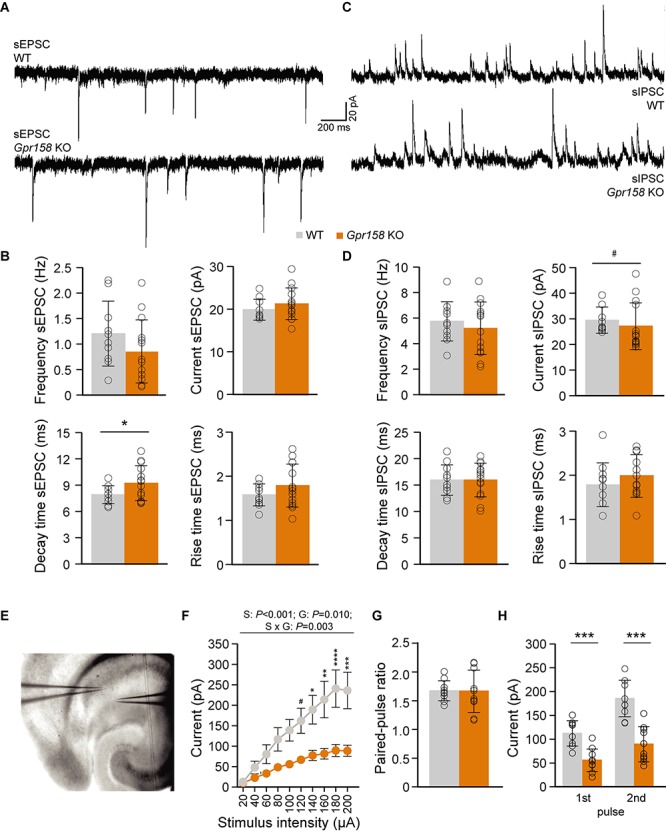
FIGURE 2.

Electrophysiological assessment of Gpr158 KO CA1 pyramidal incoming synaptic transmission. (A–D) A cesium-gluconate-based intracellular was used to record both excitatory (A,B, WT n = 10 cells from 4 animals, KO n = 14 cells from 4 animals) and inhibitory (C,D, WT n = 11 cells from 4 animals, KO n = 14 cells from 4 animals) postsynaptic currents from CA1 pyramidal cells. Example traces of xcitatory (A) and inhibitory activity (C) recorded from WT and Gpr158 KO mice. Frequency, amplitude, and rise time of sEPSCs were equal between genotypes (B). A small increase in sEPSC decay time was observed in Gpr158 KO (Supplementary Table 2). No difference was observed in sIPSC frequency, decay time, or rise time (D). However, a trend for decreased sIPSC amplitude was observed in Gpr158 KO (Supplementary Table 2). (E–H) For PPR recordings, a potassium-gluconate based intracellular was used for the recording pipette, while the stimulating pipette was loaded with aCSF and placed in a location where a clear unisynaptic response could be generated in the postsynaptic cell. Example configuration for I/O curve and PPR recordings (E; WT n = 10 cells from 4 animals, KO n = 10 cells from 3 animals). An I/O stimulation curve was generated by gradually increasing stimulation intensity in steps of 20 μA (F). A clear reduction in postsynaptic responses was observed in Gpr158 KO upon Schaffer collateral stimulation [stimulus (S): P < 0.001, genotype (G) P = 0.010; interaction P = 0.003] that became significant from 140 μA onward. A succession of two stimulations separated by 50 ms was applied at stimulation intensity approximately half-maximal to that generated during the I/O curve. The ratio between the 1st and 2nd response amplitude was equal between genotypes (G). The raw amplitudes recorded during half-maximal stimulation during the PPR protocol differed significantly (H). For panel (F) data are presented as mean ± SEM. For all other panels data are presented as mean ± SD with individual data points indicated. Asterisks and octothorpe indicate the level of significance between WT and KO assessed by Student’s t-test or MWU (Supplementary Table 2), #P ≤ 0.100; ∗P ≤ 0.050; ∗∗∗P ≤ 0.001.
