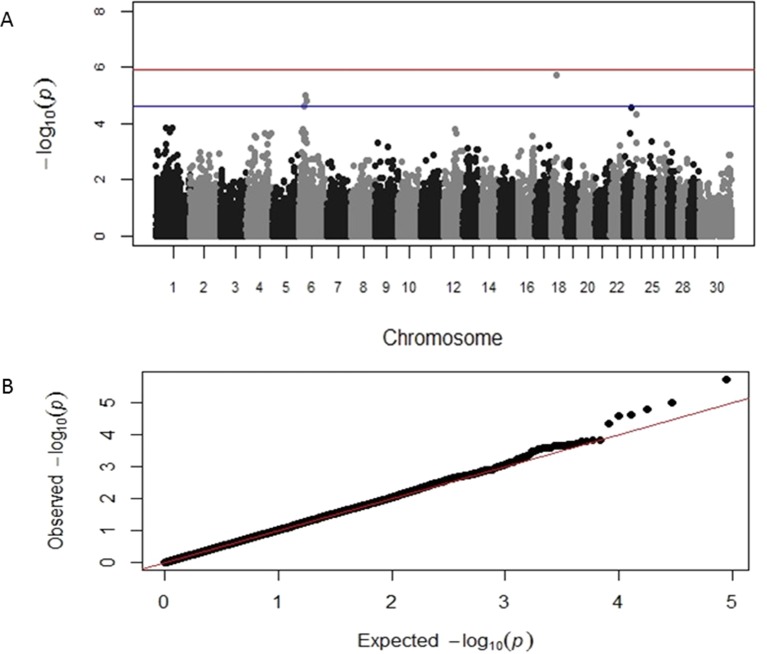
Figure 2.
Manhattan and Q-Q plots displaying the genomic association results for telomere length at birth. (A) Genomic location is plotted against −log10(P). Red and blue lines, respectively, are thresholds for significance post-Bonferroni correction (P < 0.05) and for suggestive significance (accounting for one false positive per genome scan). (B) Observed P-values are plotted against the expected P-values.

